How much totality is left in your life?
The morning of the 2026 solar eclipse I stood in a room full of friends and strangers while someone tried to wrangle cars. "Who here has seen a solar eclipse?" he asked. A bunch of hands went up. "And who thinks it was the coolest thing they've ever witnessed in their entire life?" The hands stayed up. "I would recommend for your life that you go --- you won't know any different --- but the other path is better."
The other path is better. I hope you see an eclipse.
There are 124 total and hybrid solar eclipses between now and the end of 2200 offering just over seven hours of eclipse time. You won't get it all. Sometimes the shadow of the eclipse falls on Antarctica or the open ocean, or in a country known for its violence and inaccessibility to outsiders. More importantly, you'll (likely) be dead for most of the eclipse.
So, how much time do you have?
The calculator
A few quick conclusions
- As of 2026, young child has about 2 hours of eclipse time while someone near mid-life has closer to an hour.
- Most of this time comes earlier in life due to steep drop-offs in survival and fitness (the ability and gumption to travel for eclipses) later in life.
- Given the fitness model we've used here, by one's late sixties the fitness discount is as large as the mortality discount. Exercise and self-care are important to maximizing totality!
- Unreachable eclipses don't add much to the total time. For instance, adding Antarctica and at-sea eclipses only raises expectated totality time by 7-14 minutes (5 vs 40 year-old) because long eclipses happen near the equator with the sun high overhead, and equatorial destinations are generally easy to travel to.
How it works
The eclipses
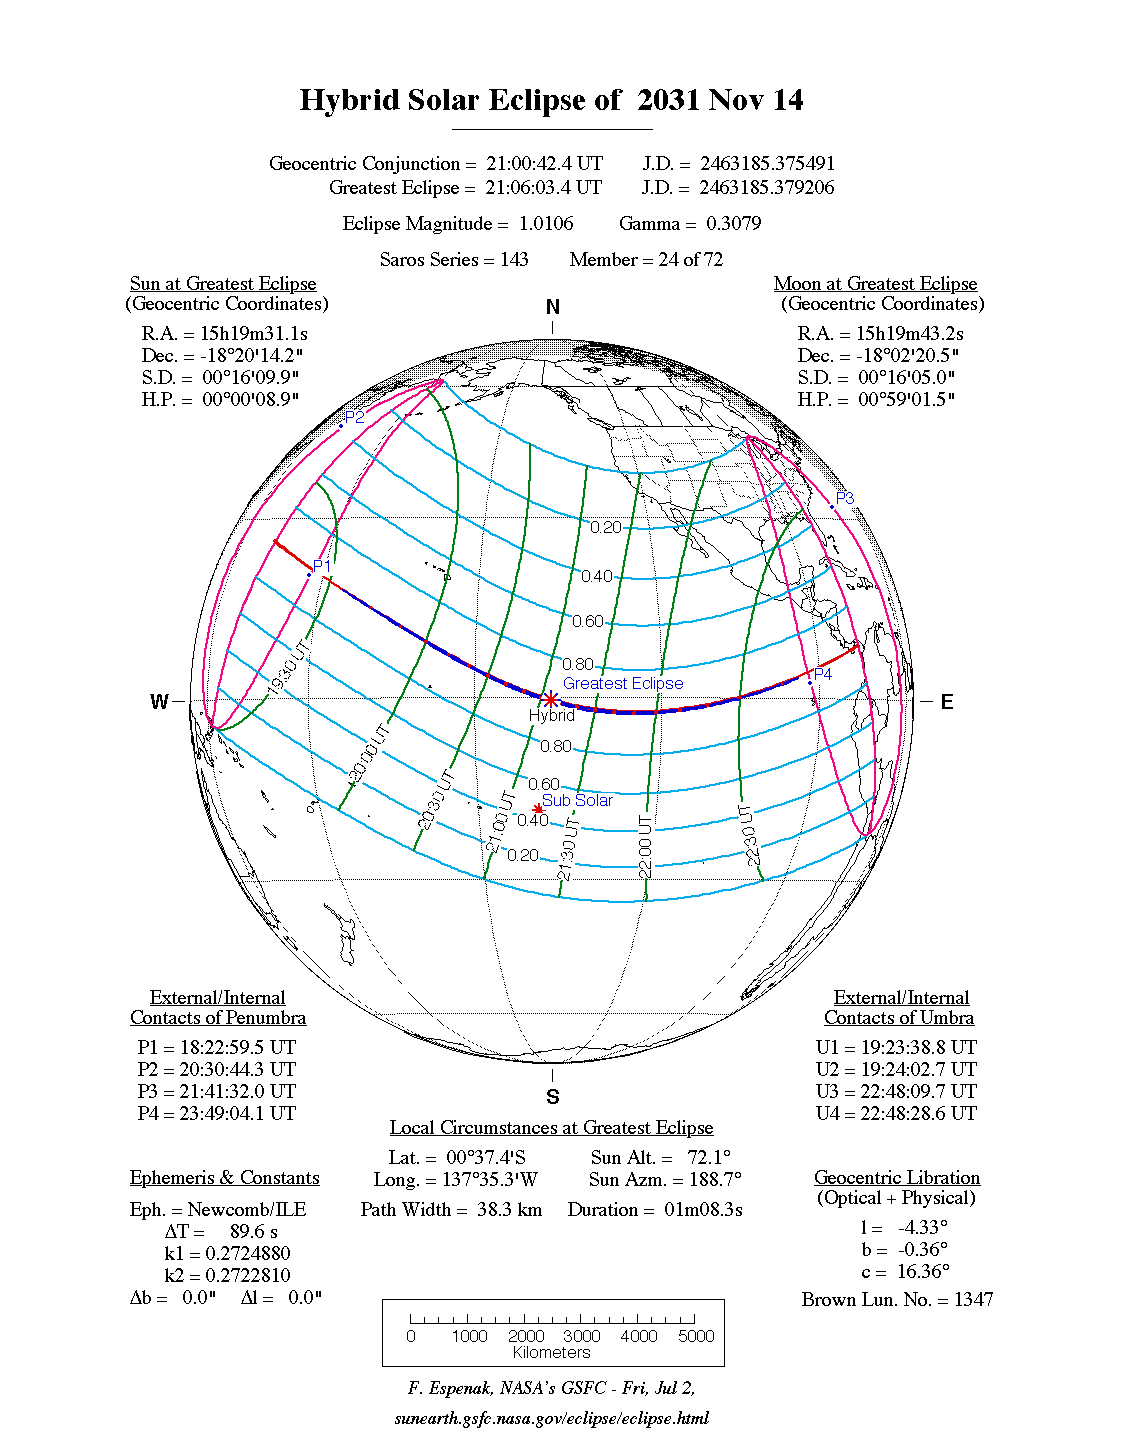
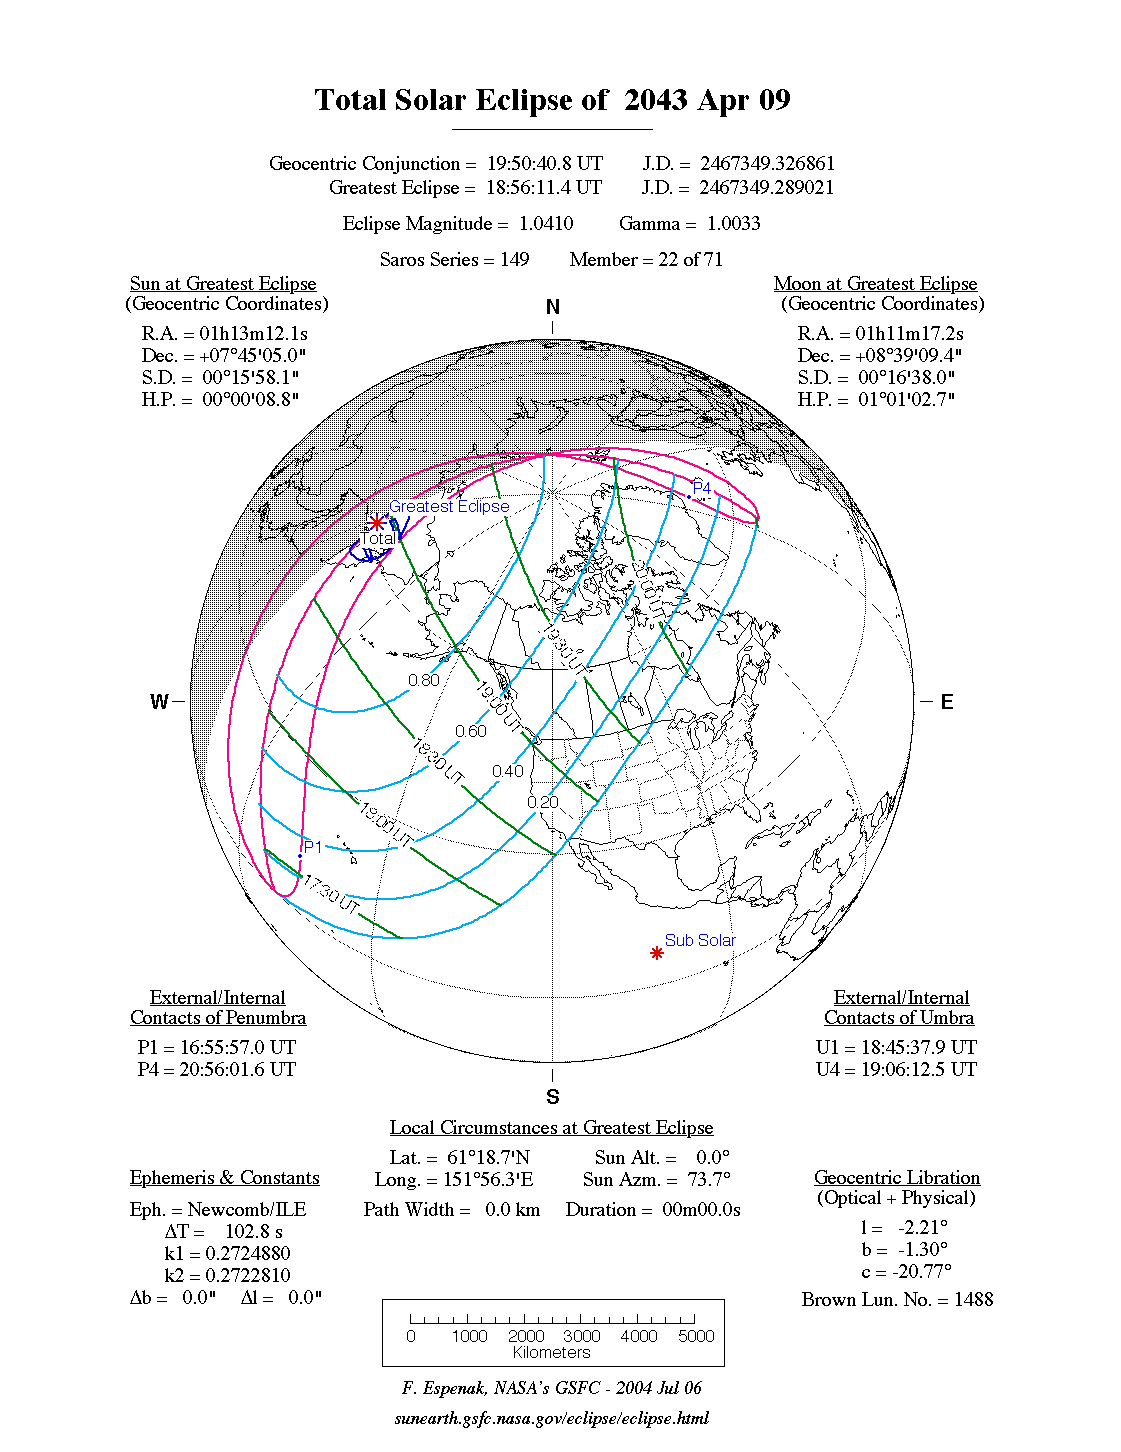
Eclipse data is drawn from NASA's Five Millennium Catalog of Solar Eclipses by Fred Espenak1 and includes every total (T) and hybrid (H) eclipse from today through 2200. Hybrids are total along part of their track and annular elsewhere. Additionally, there's a total eclipse on 9 April 2043 which only grazes the Earth over eastern Siberia and has no central line. This is omitted from the calculator.
Predictions of this time period are reliable. There is a slow, irregular drift in Earth's rotation, but this only shifts by some kilometers where along an eclipse path a given moment falls without really affecting how long totality lasts.
How much totality you can actually get
NASA tracks totality at the point of greatest eclipse, but that's often in an ocean. I've taken the center line2, interpolated it, and sampled points both on and near it to find the longest totality over land3 the eclipse crosses. Off-center, totality shortens as √(1 − f²), where f is the fraction of the way from the center line to the edge of the eclipse path.
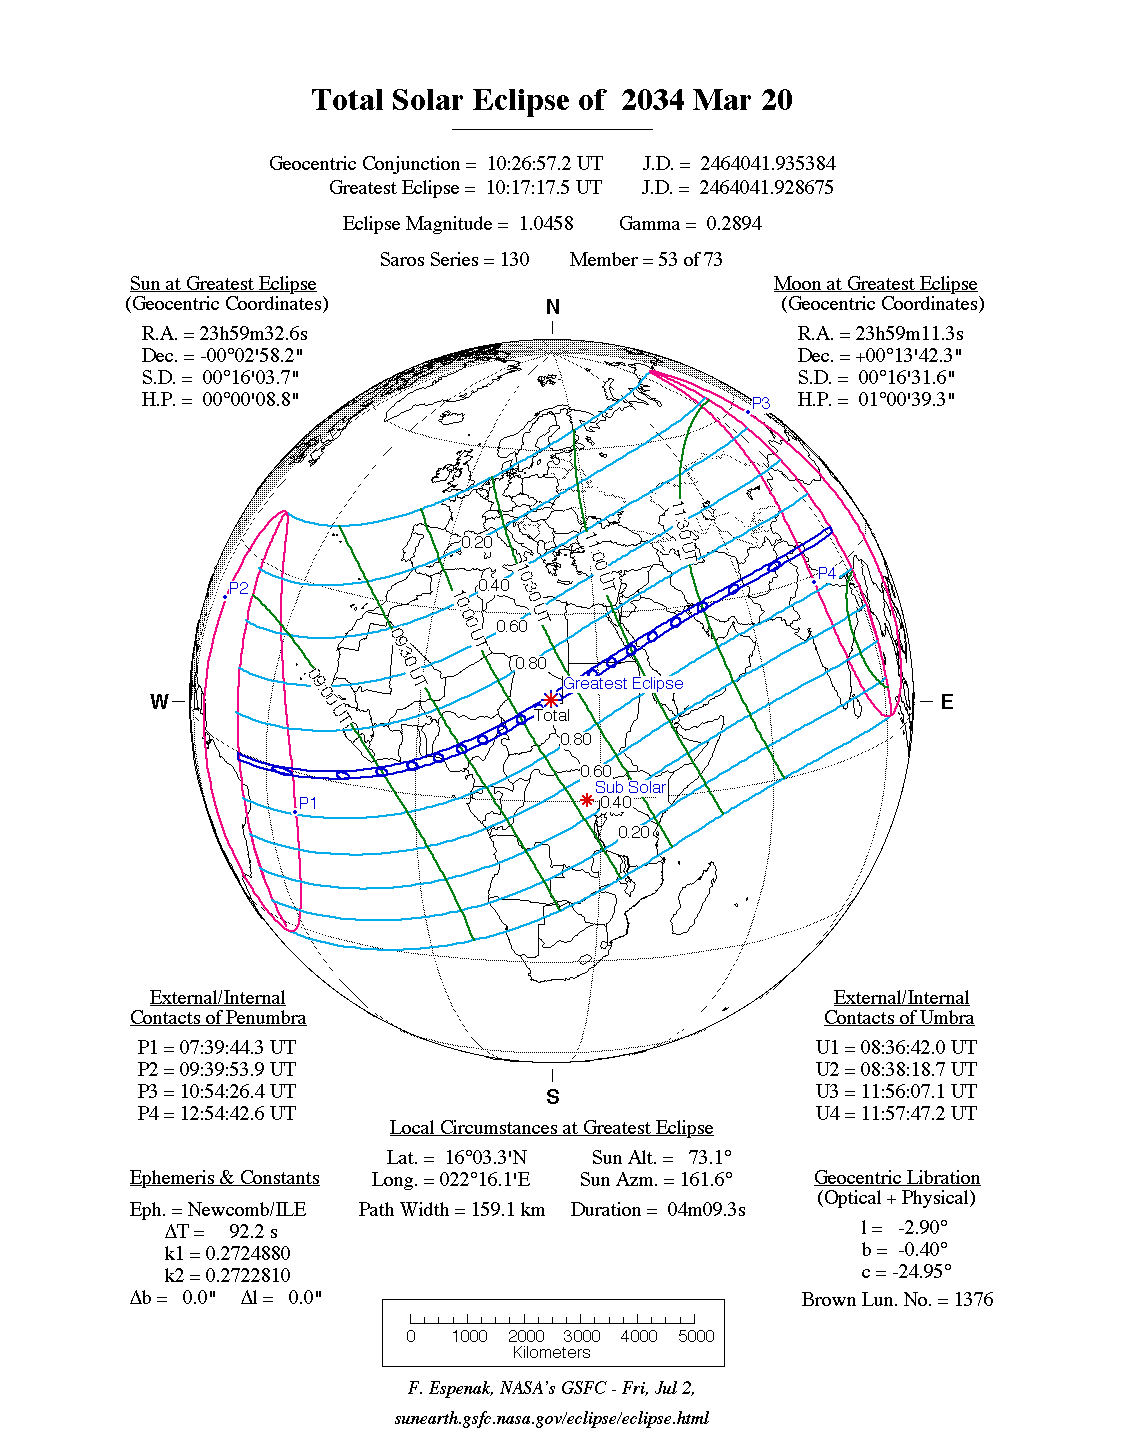
NASA hasn't published path tables after 2100, so for 2101–2200 I calculated the paths myself. Cross-checking these against NASA's tables for the 21st century shows agreement to within a few seconds and durations of totality about 1% longer than NASA's published values. If the longest land totality is in a hard-to-reach place but an easy country is only a little shorter, my table shows the easy one. For instance, the 2034 eclipse is 4m09s in Chad but 3m56s in Egypt, so my table says Egypt.
Difficulty
There are three tiers:
- Easy: a commercial flight and a hotel. Spain, Egypt, Australia, the continental US, Japan, Chile.
- Remote: commercial travel to get there, but real logistics thereafter: Arctic Alaska in March, Siberia, the Russian Urals, overland Angola.
- Expedition: Antarctica, the Kerguelen Islands, or a ship at sea.
The rule I've applied is that the table lists the country with the longest totality from a list of easy-to-visit countries. If a harder country offers more than a third longer time, then the harder one is listed and the eclipse is listed as being remote or an expedition.
The chance you'll be alive
Survival probabilities come from the 2024 United States life tables published by the National Center for Health Statistics4, separately for males, females, and the total population. Between whole ages I interpolated linearly in the log of the number of survivors. This is equivalent to assuming a constant death rate within each year of age. The tables stop at "100 and over," so beyond 100 I assume a constant death rate equal to the reciprocal of the table's life expectancy at 100 (about two years).
The probability shown for an eclipse is the chance someone of a given age today survives to their age on that date. The expected totality for an eclipse is its duration times that probability, and the lifetime figure is the sum over the eclipses you're willing to travel to.
Fitness to travel (optional)
Being alive isn't the same as being willing to fly to Siberia. Ticking the fitness box multiplies survival by a crude second factor of 1.0 until age 60 and then declining by 2.8 percentage points each year, reaching zero around 96. This is guess-work.
Caveats
- Period life tables understate your odds. If mortality keeps improving, the later probabilities are too low.
- You aren't the average American. Income, health, where you live, and how you live move survival a great deal. Also, if you're planning inter-continental travel for eclipse trips, you're not a typical member of the population.
- The land map is coarse. The country boundaries I used were at 1:50 million scale, which misses small islands, and the path tables are sampled every two minutes; durations on land could be off by a few seconds.
- Weather is ignored. Even at a well-chosen site a clear sky is never guaranteed, so the totality you actually see is lower still.
- The 22nd century is computed, not tabulated. Its land durations come from my own path calculation rather than NASA's tables. Since the uncertainty in Earth's position grows with time the exact location of the eclipse becomes harder to predict as well. This doesn't matter too much since few people reading this post are likely to live long enough to be confused by the discrepancies.
Appendix: eclipse paths
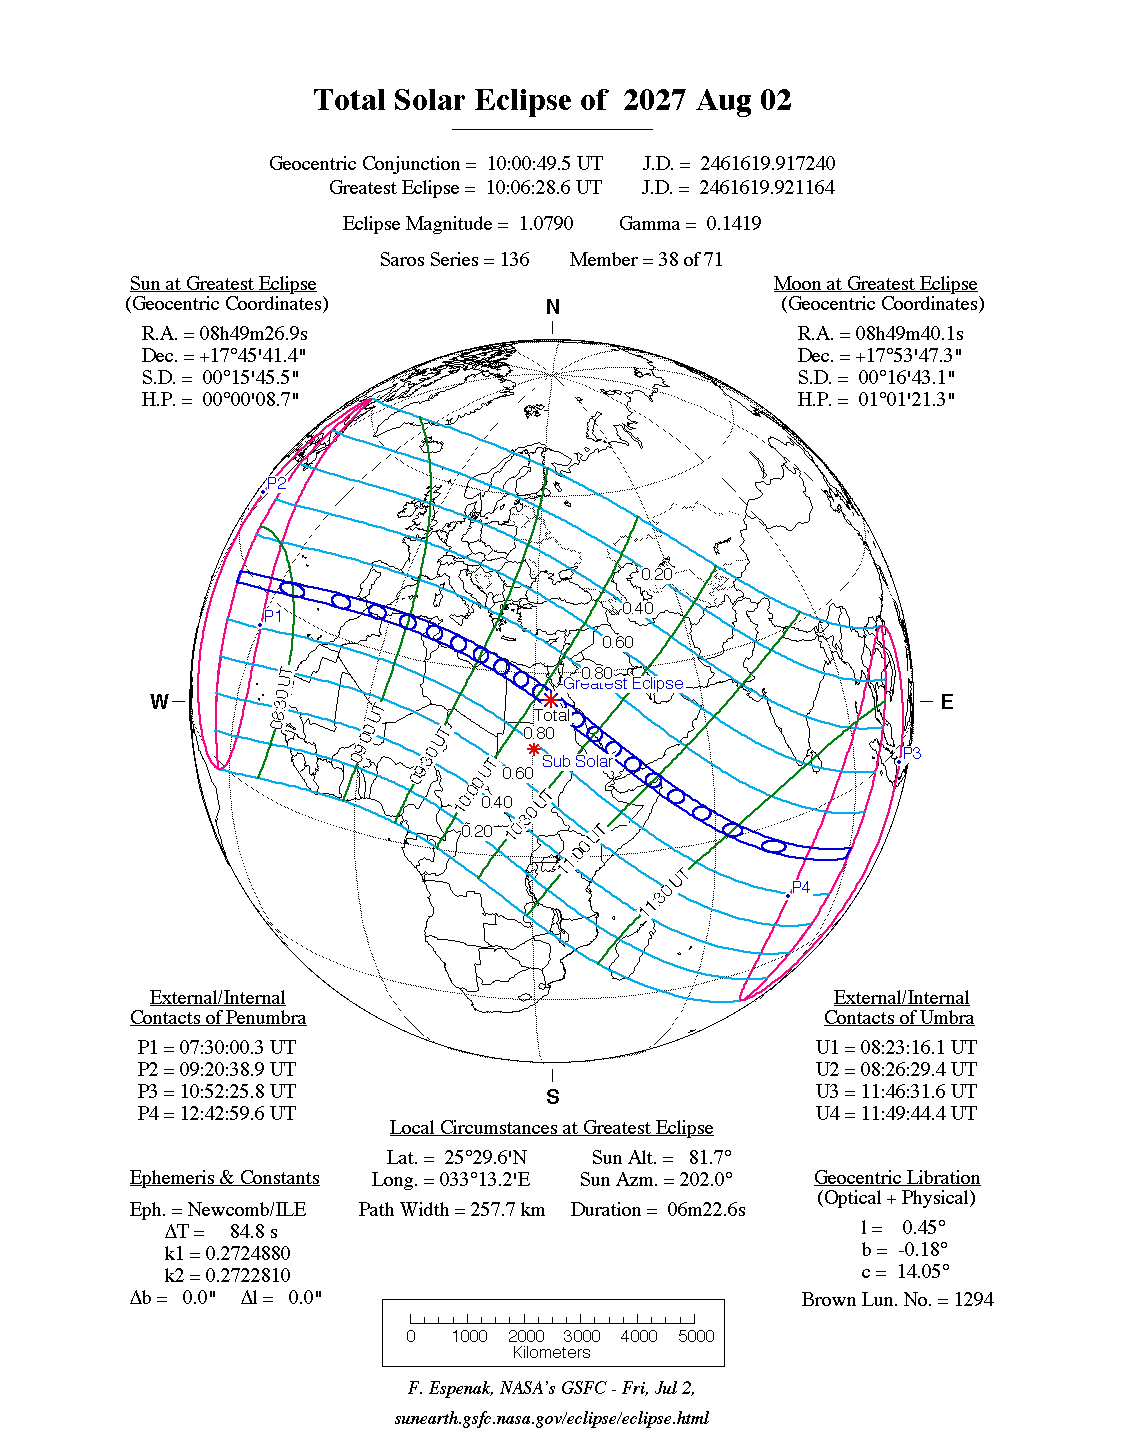
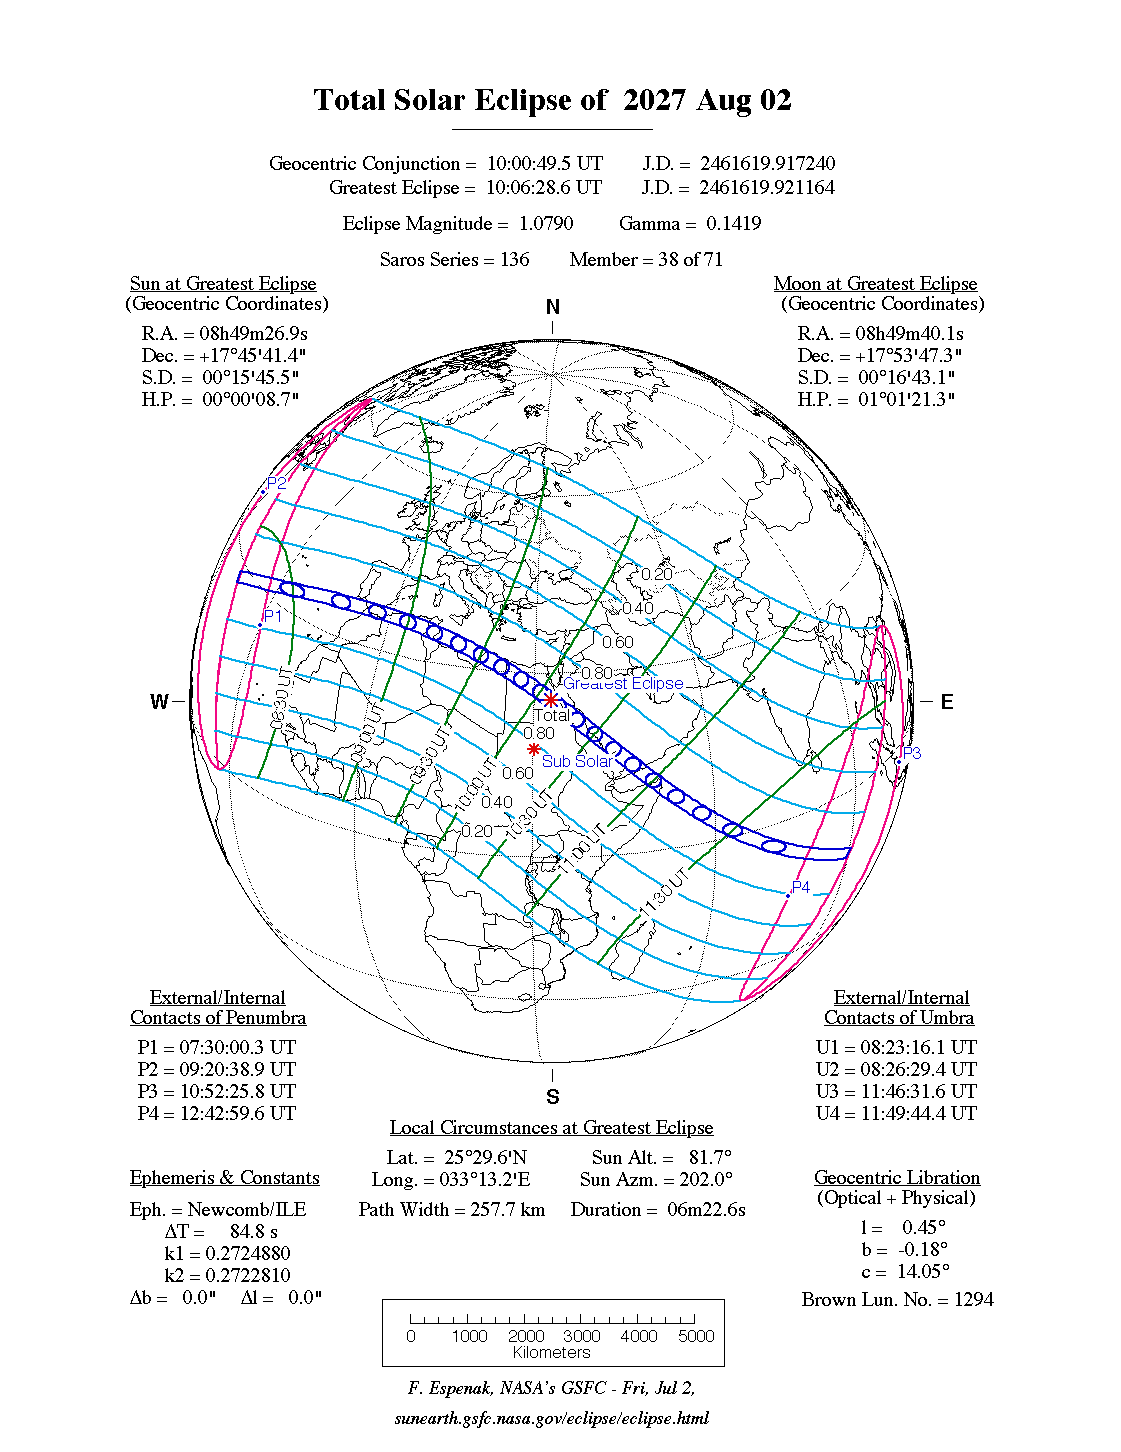
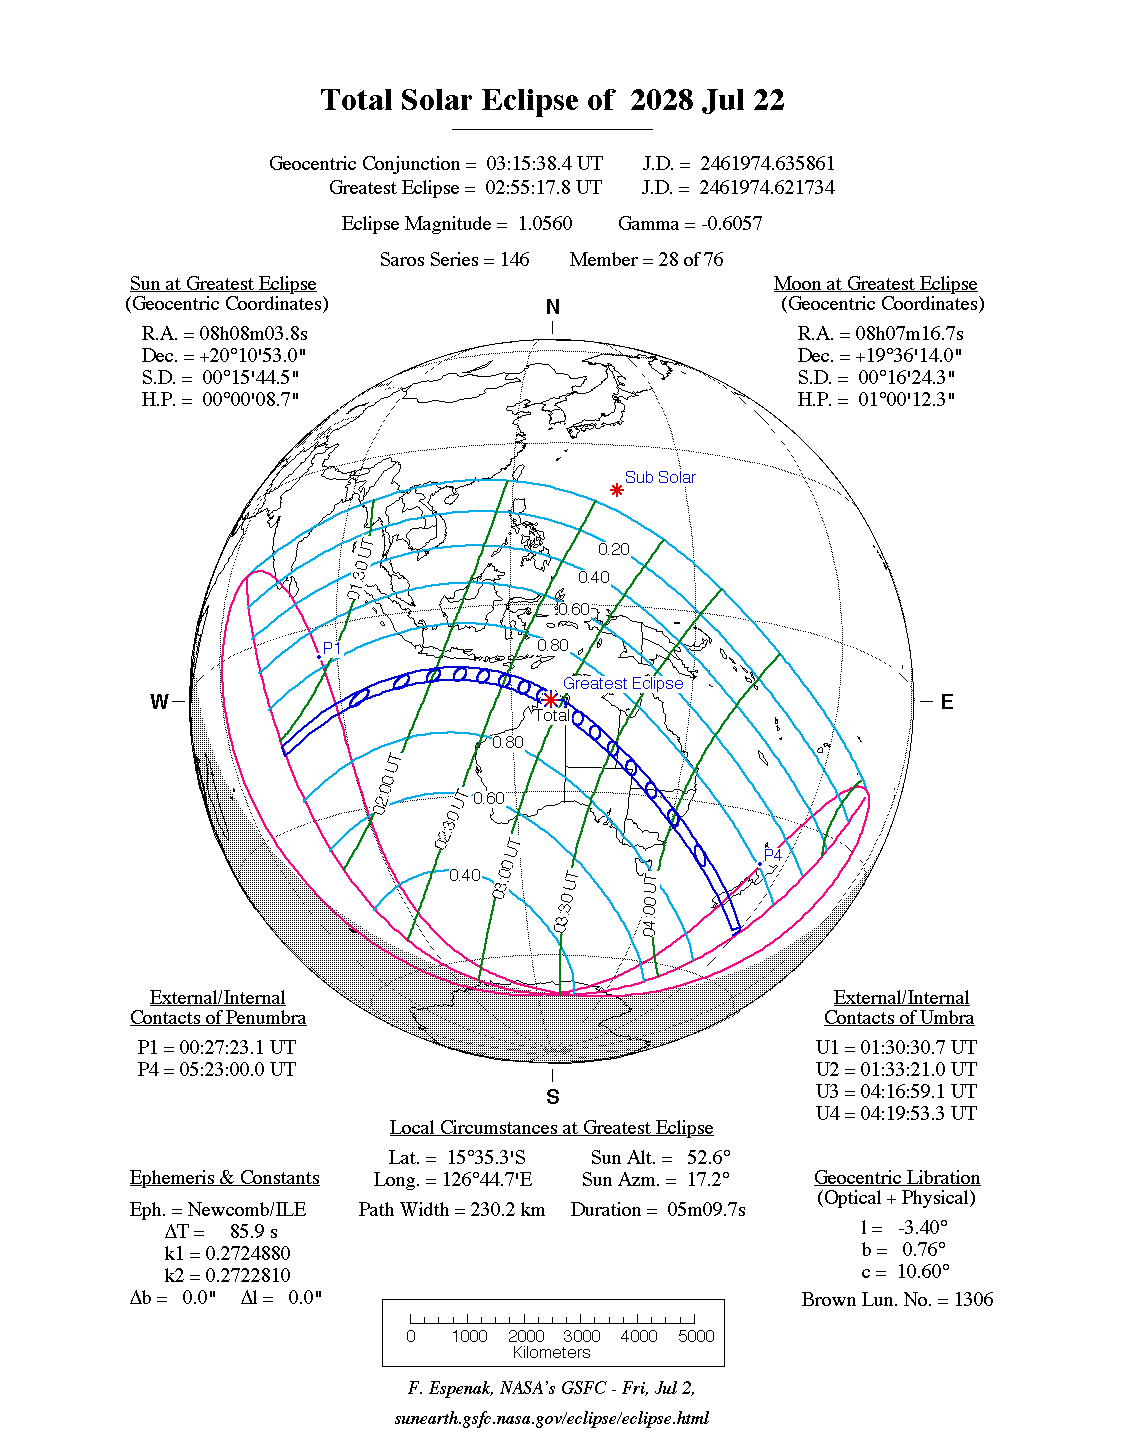
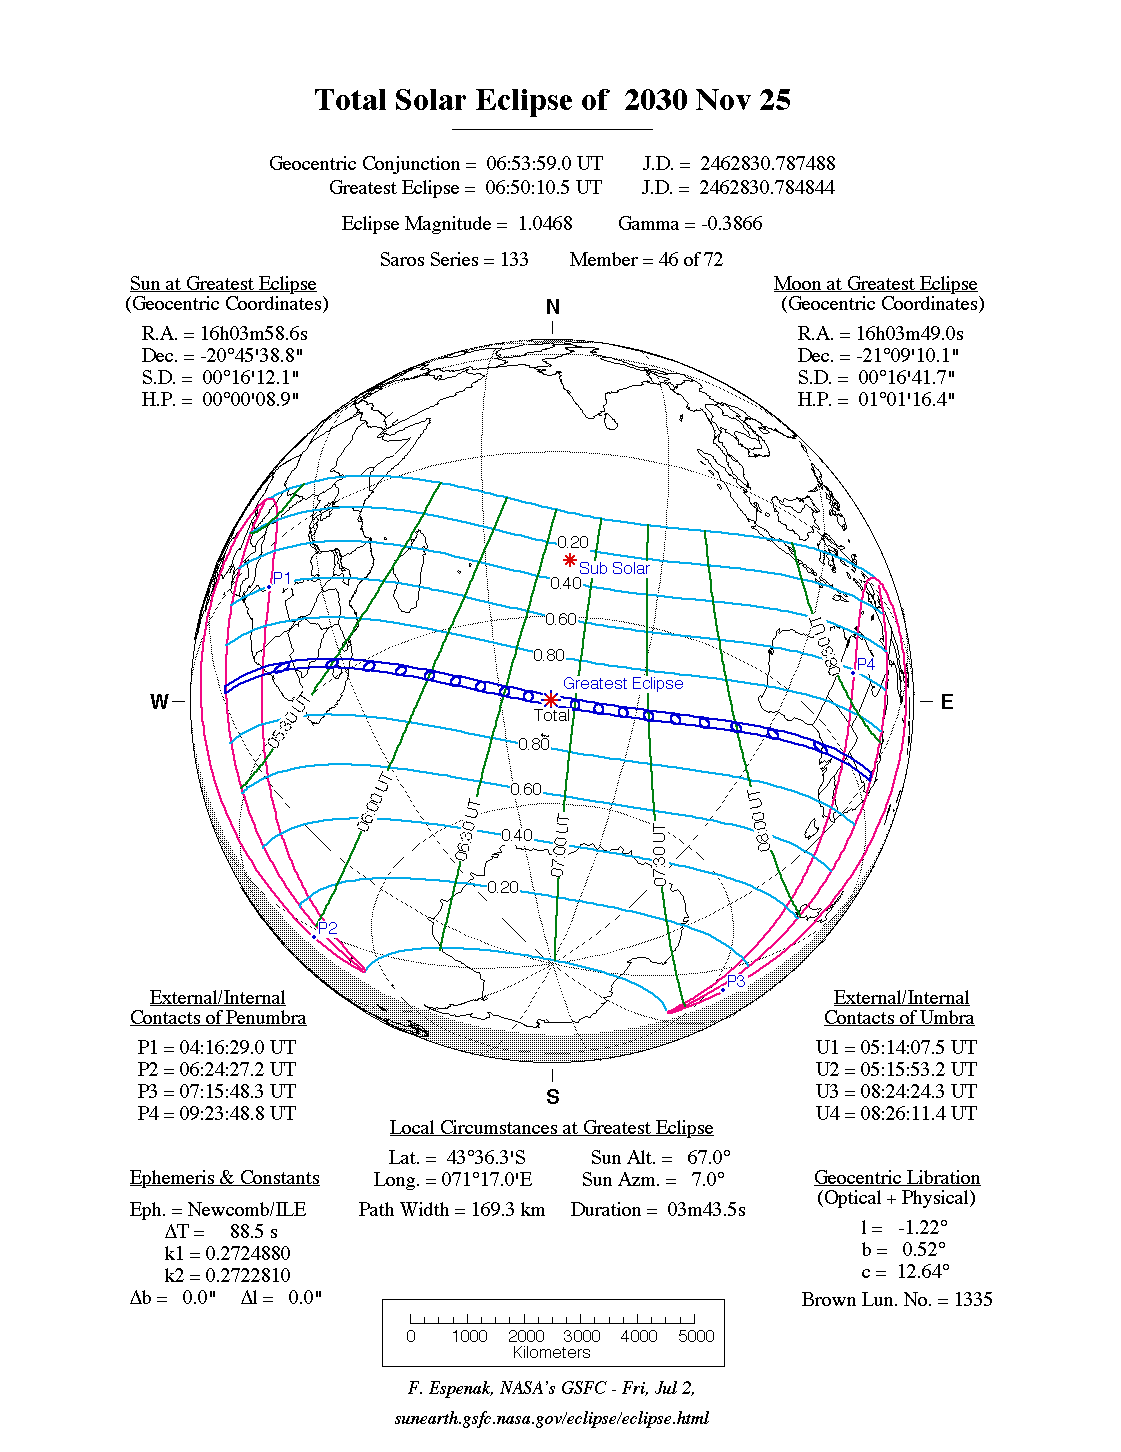
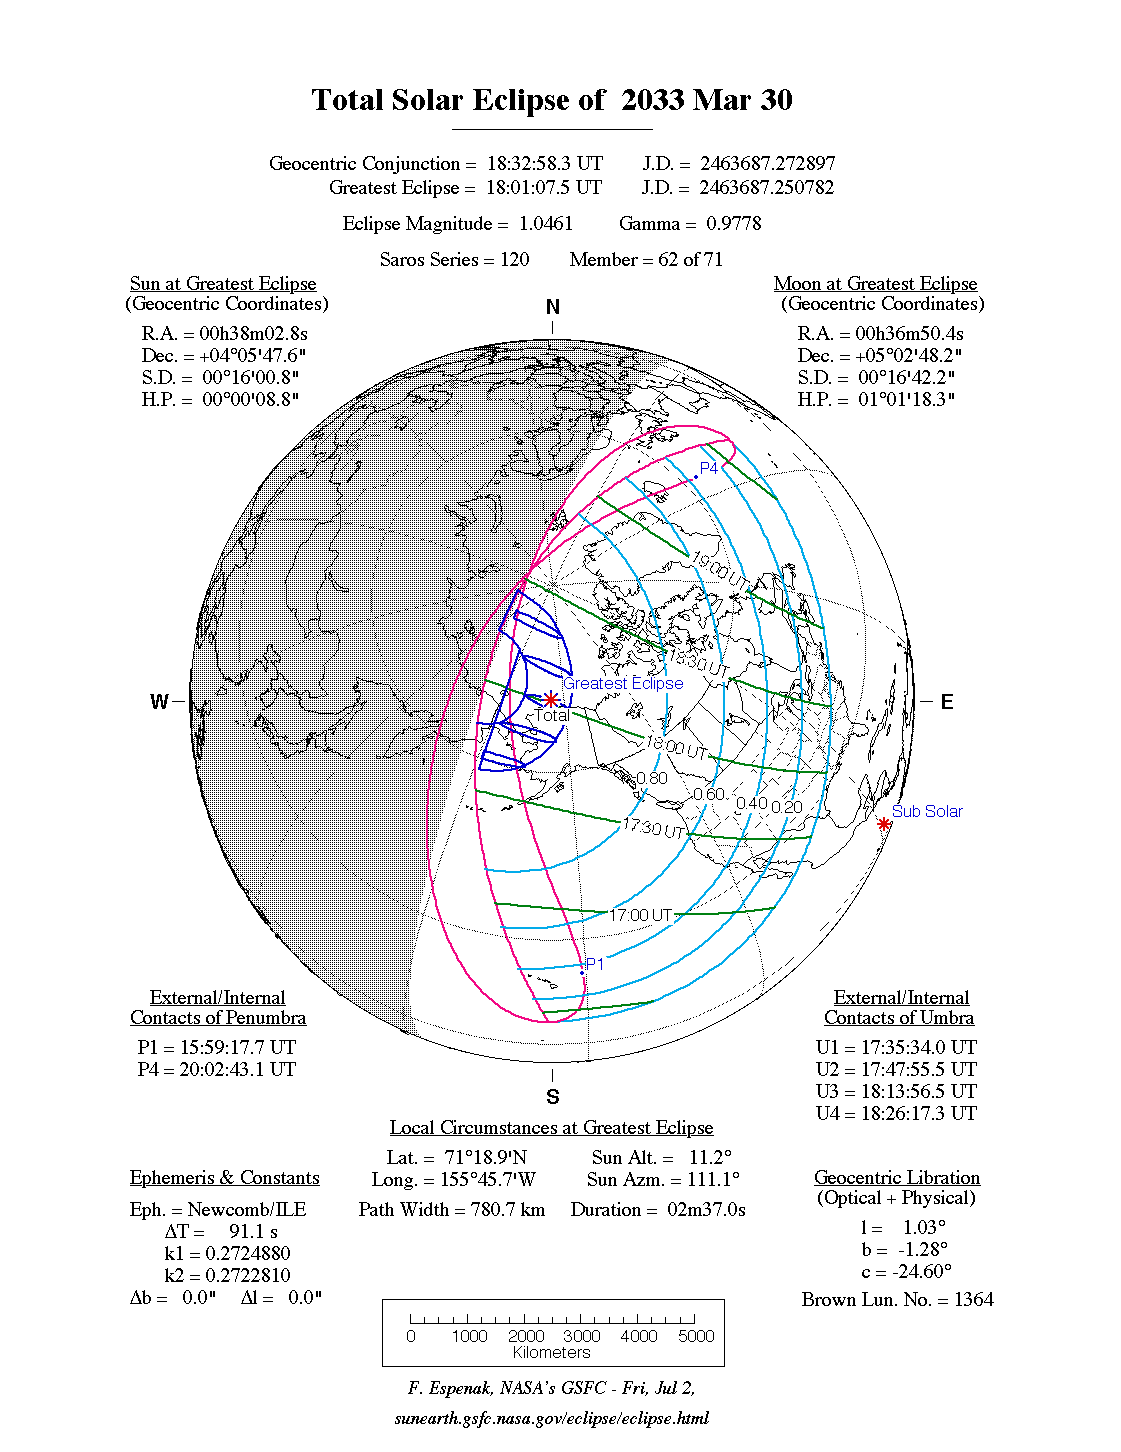
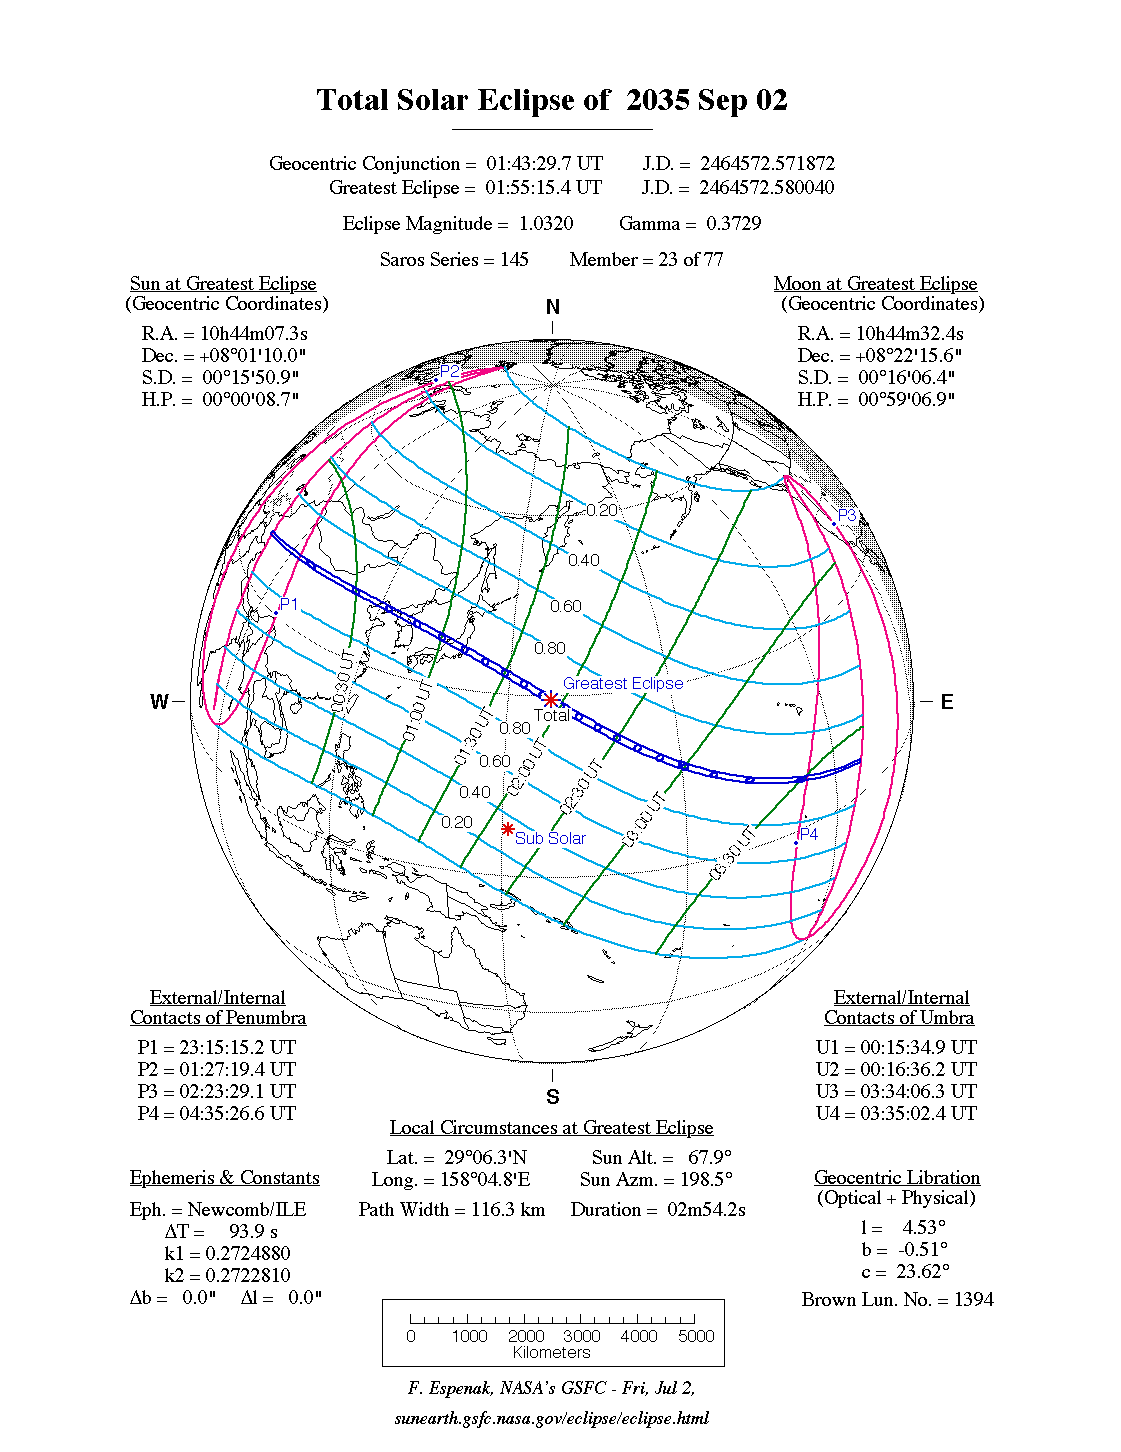
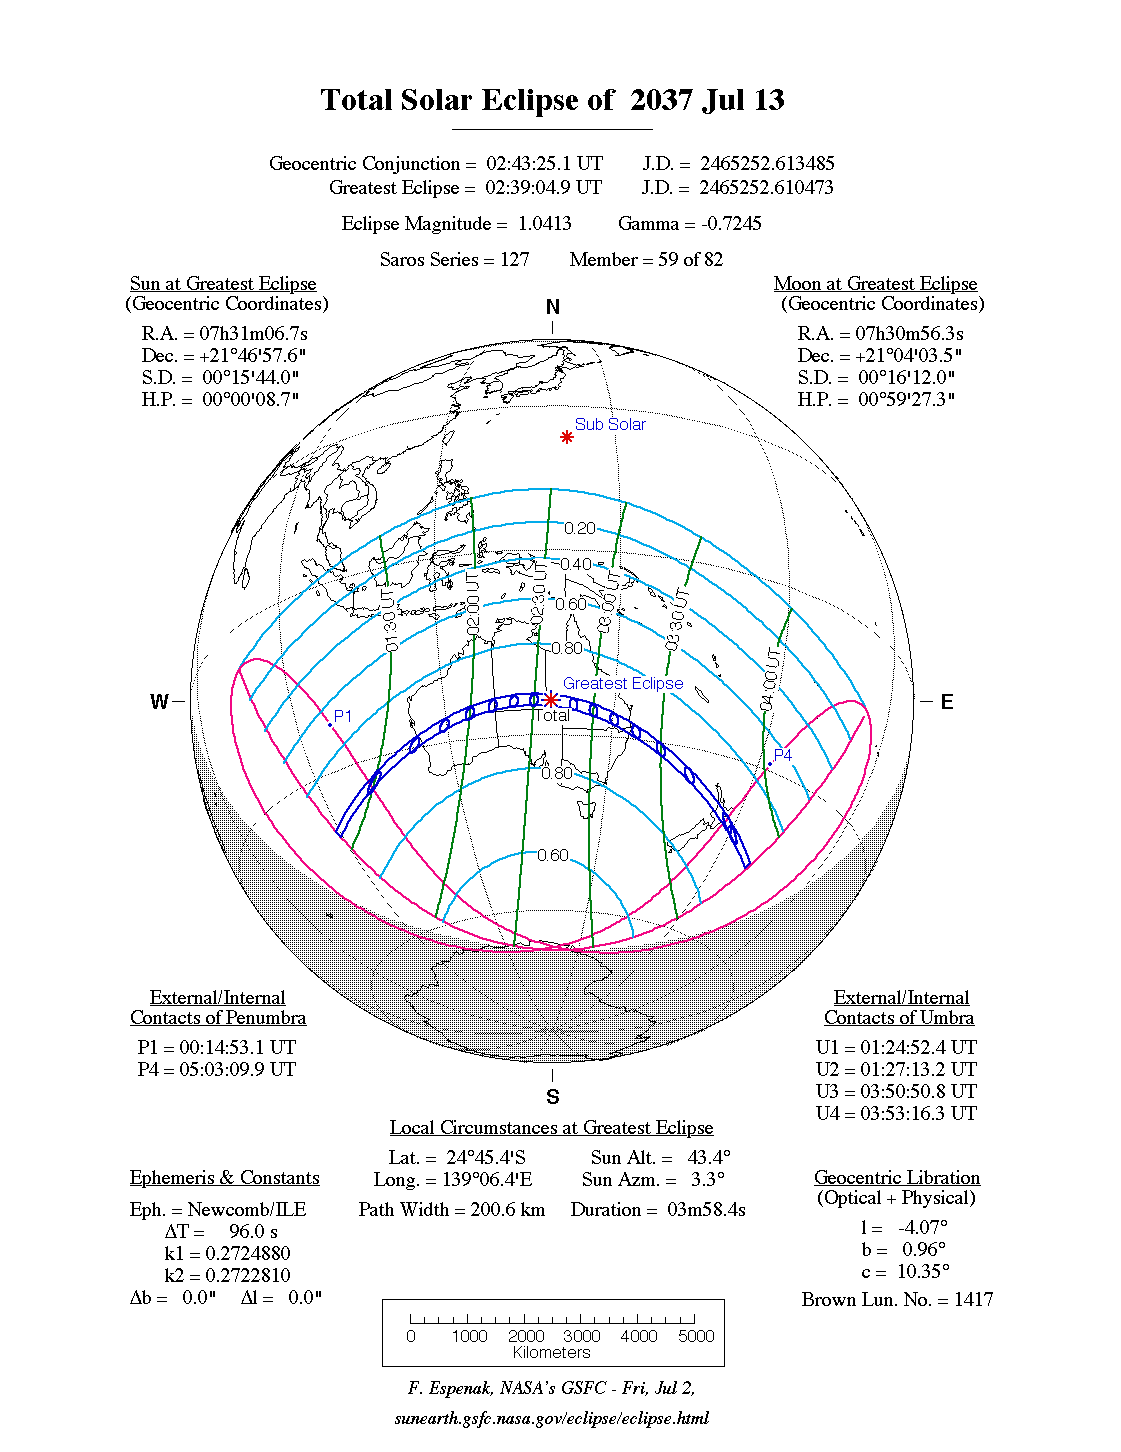
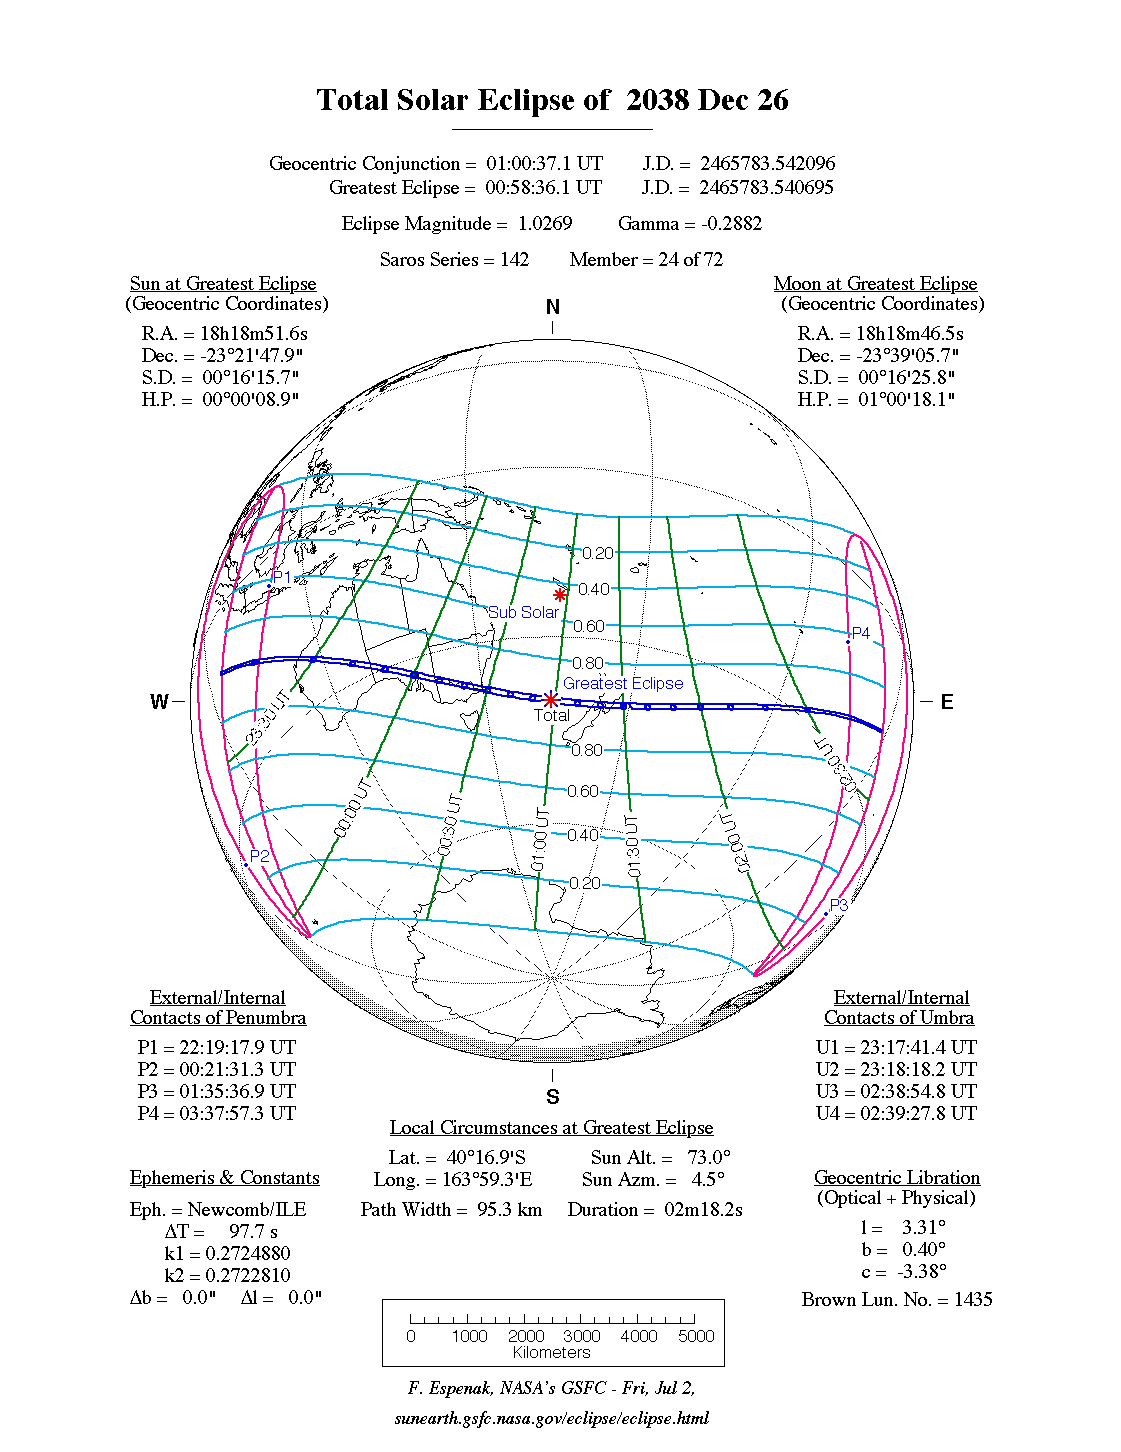
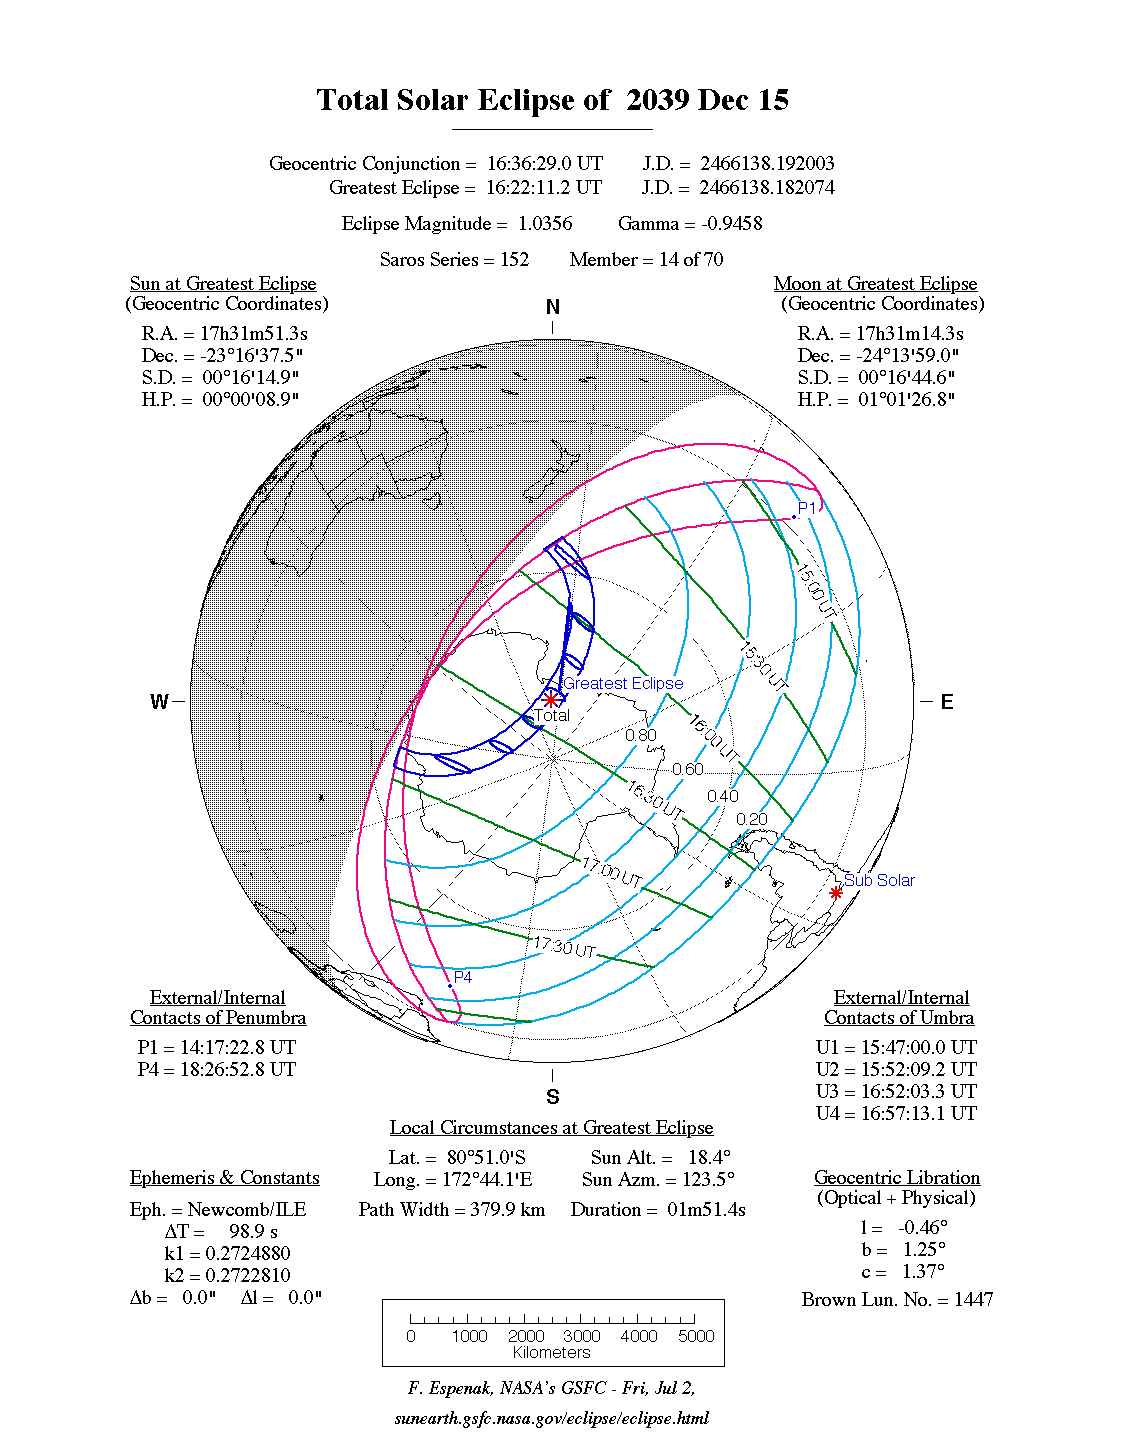
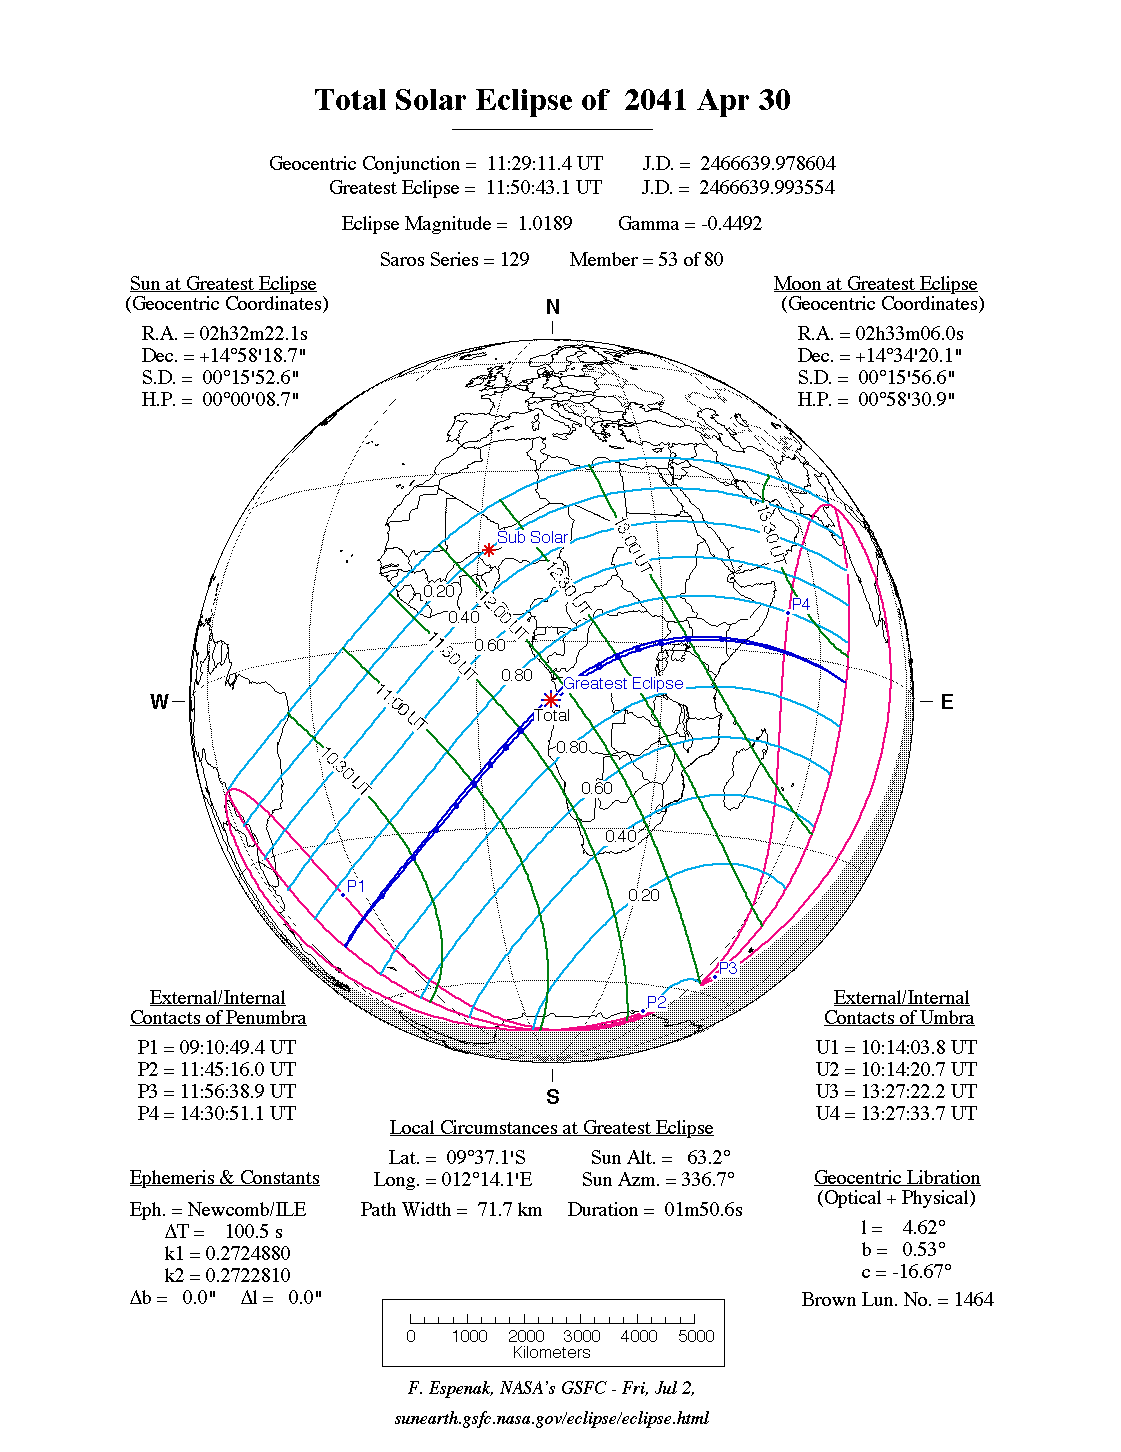
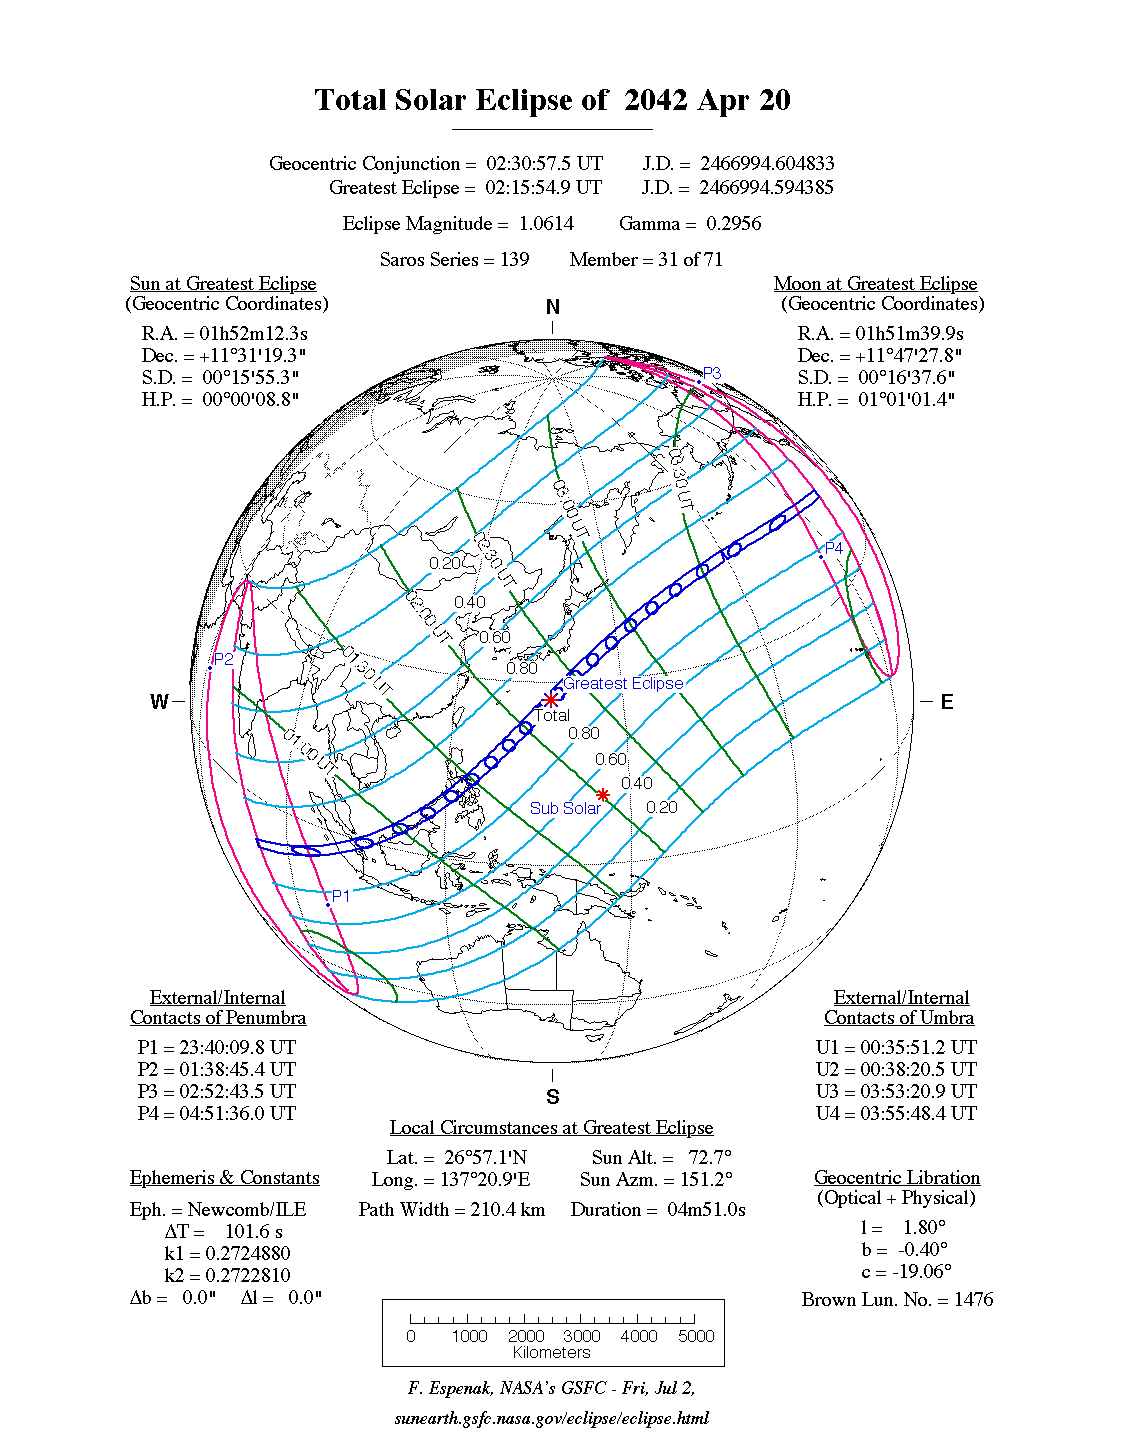
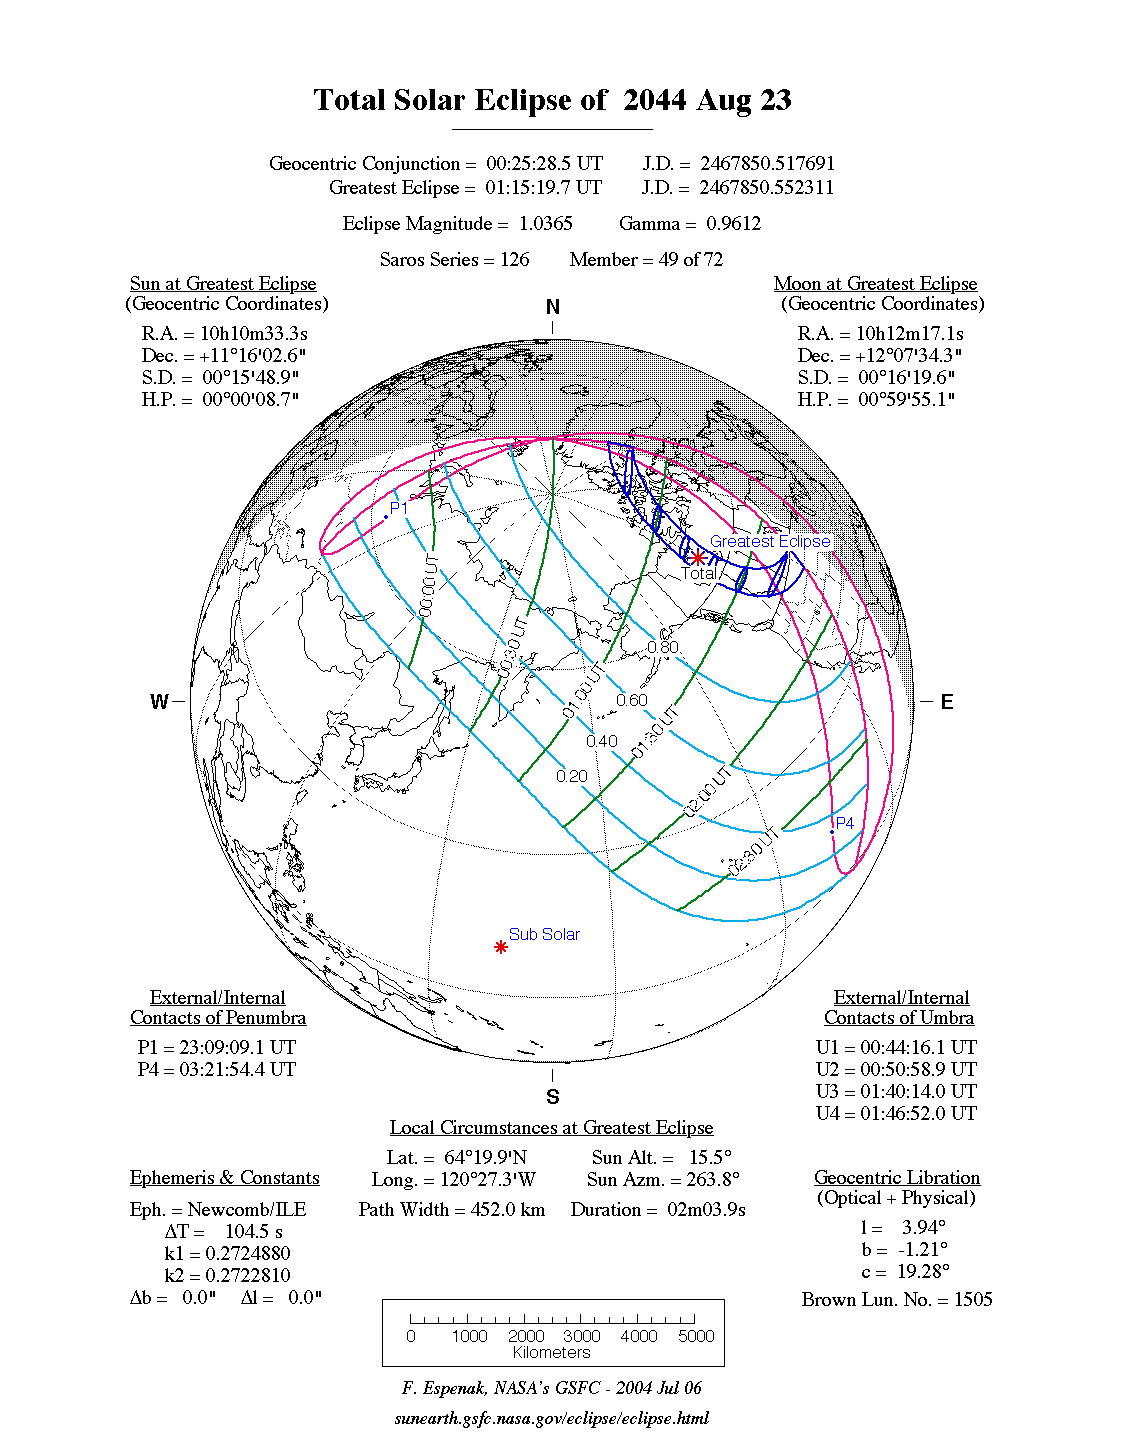
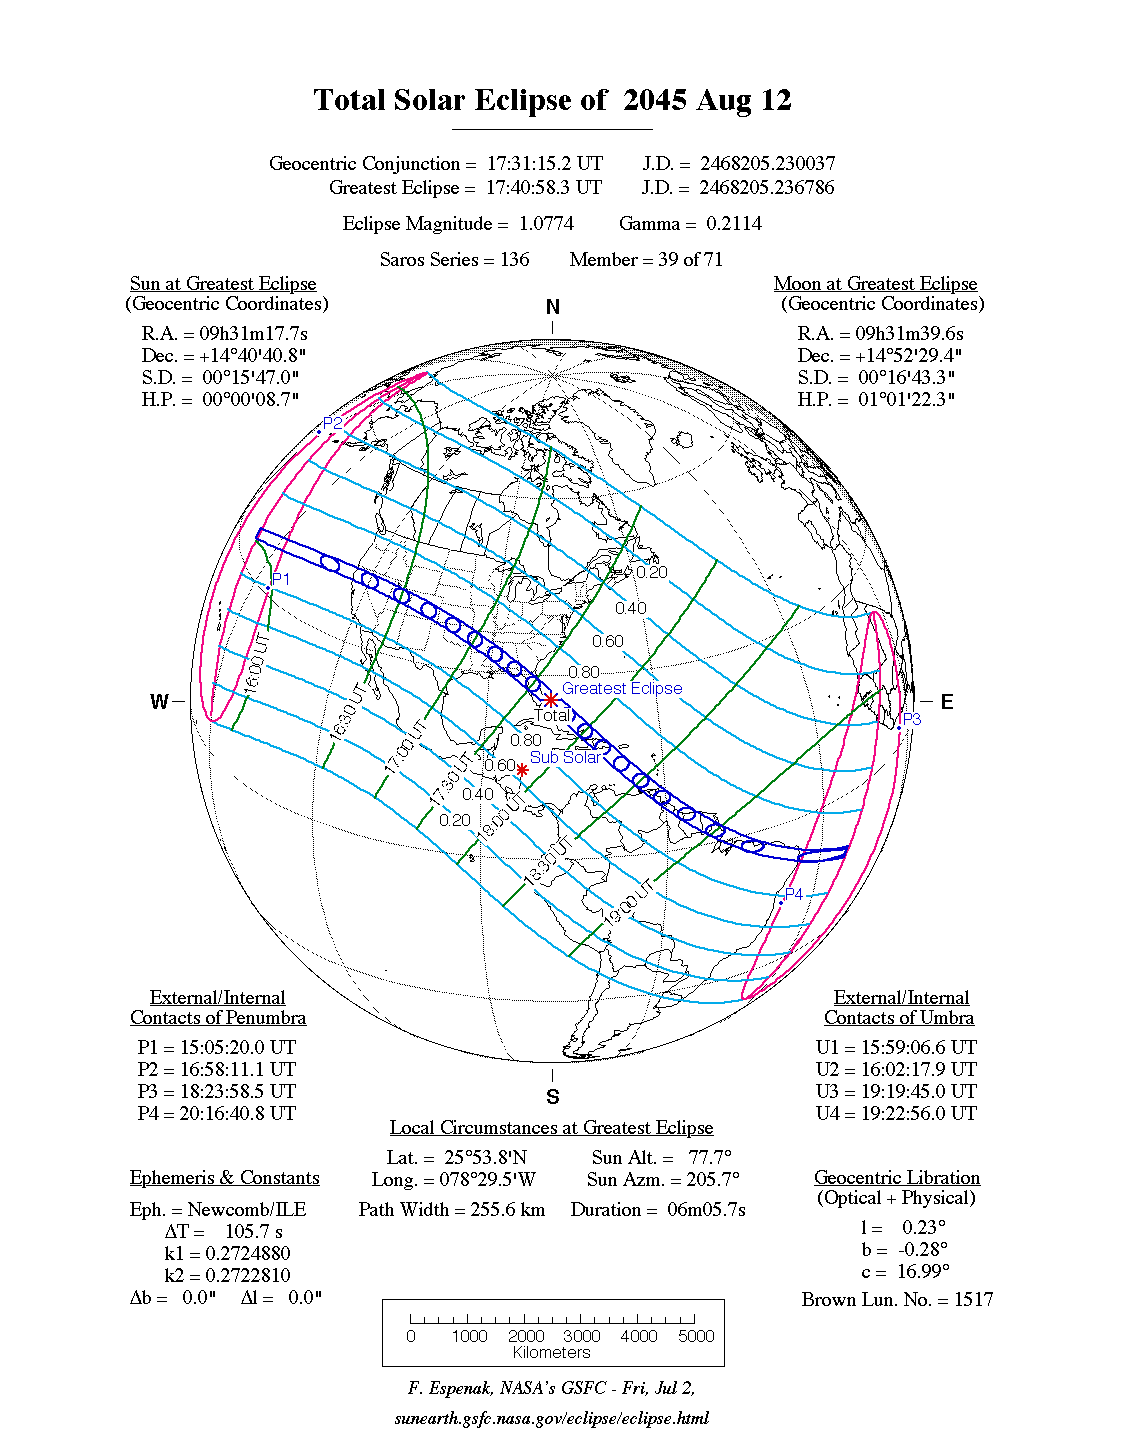
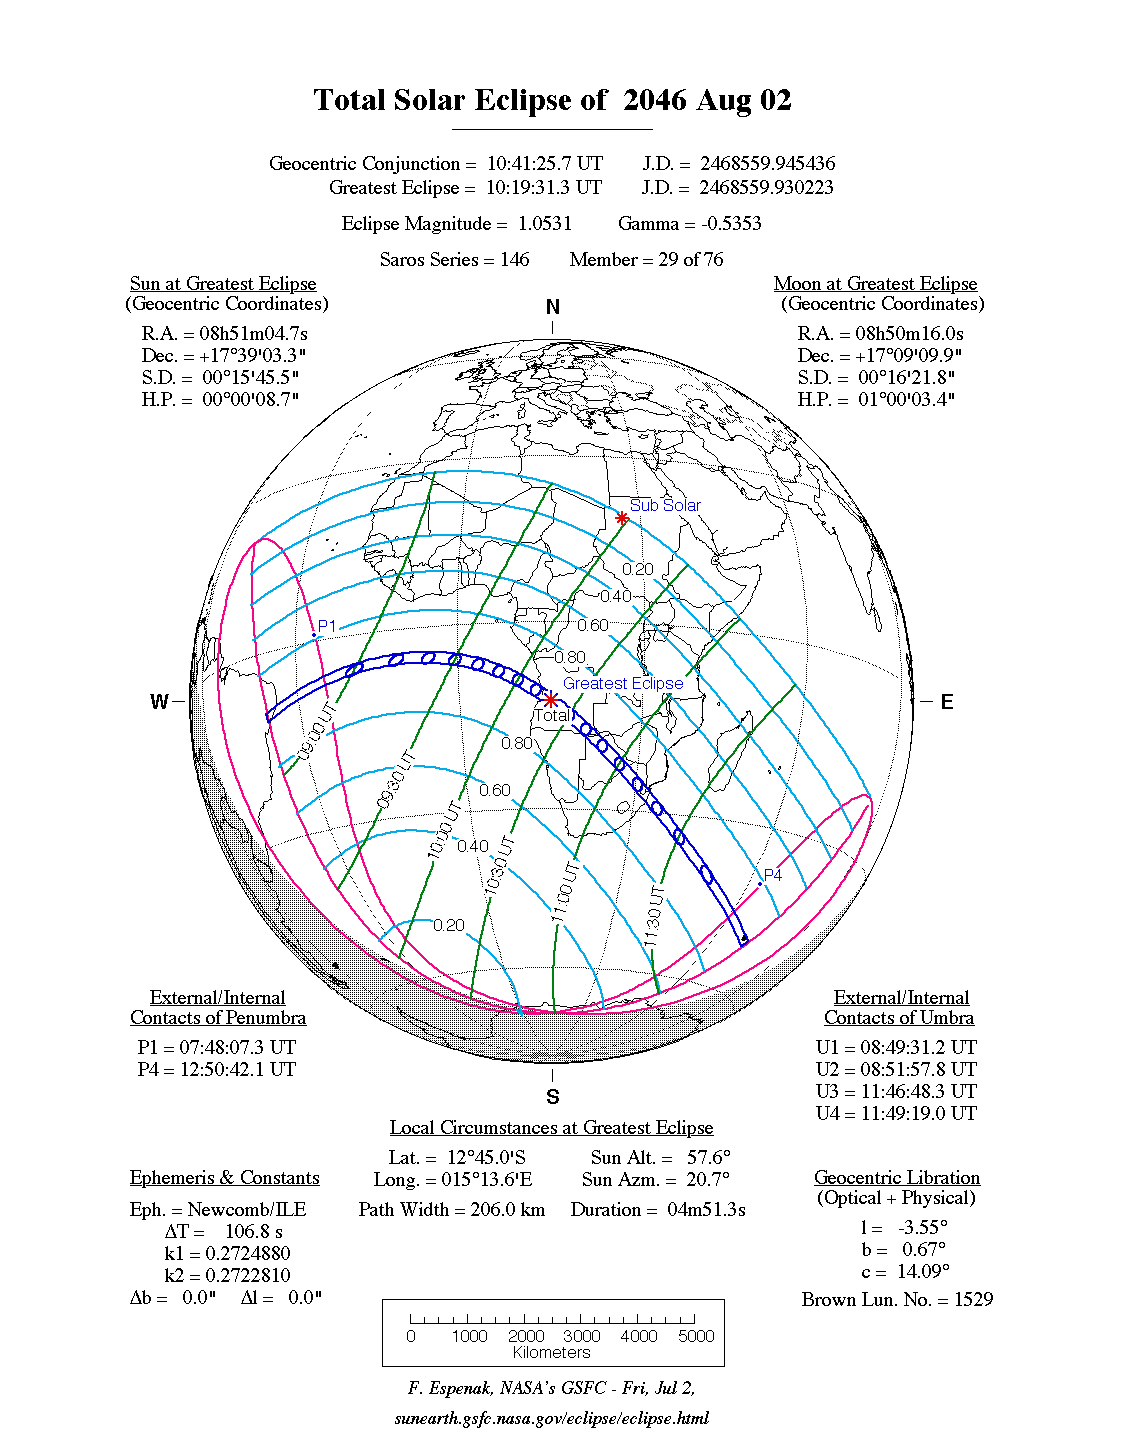
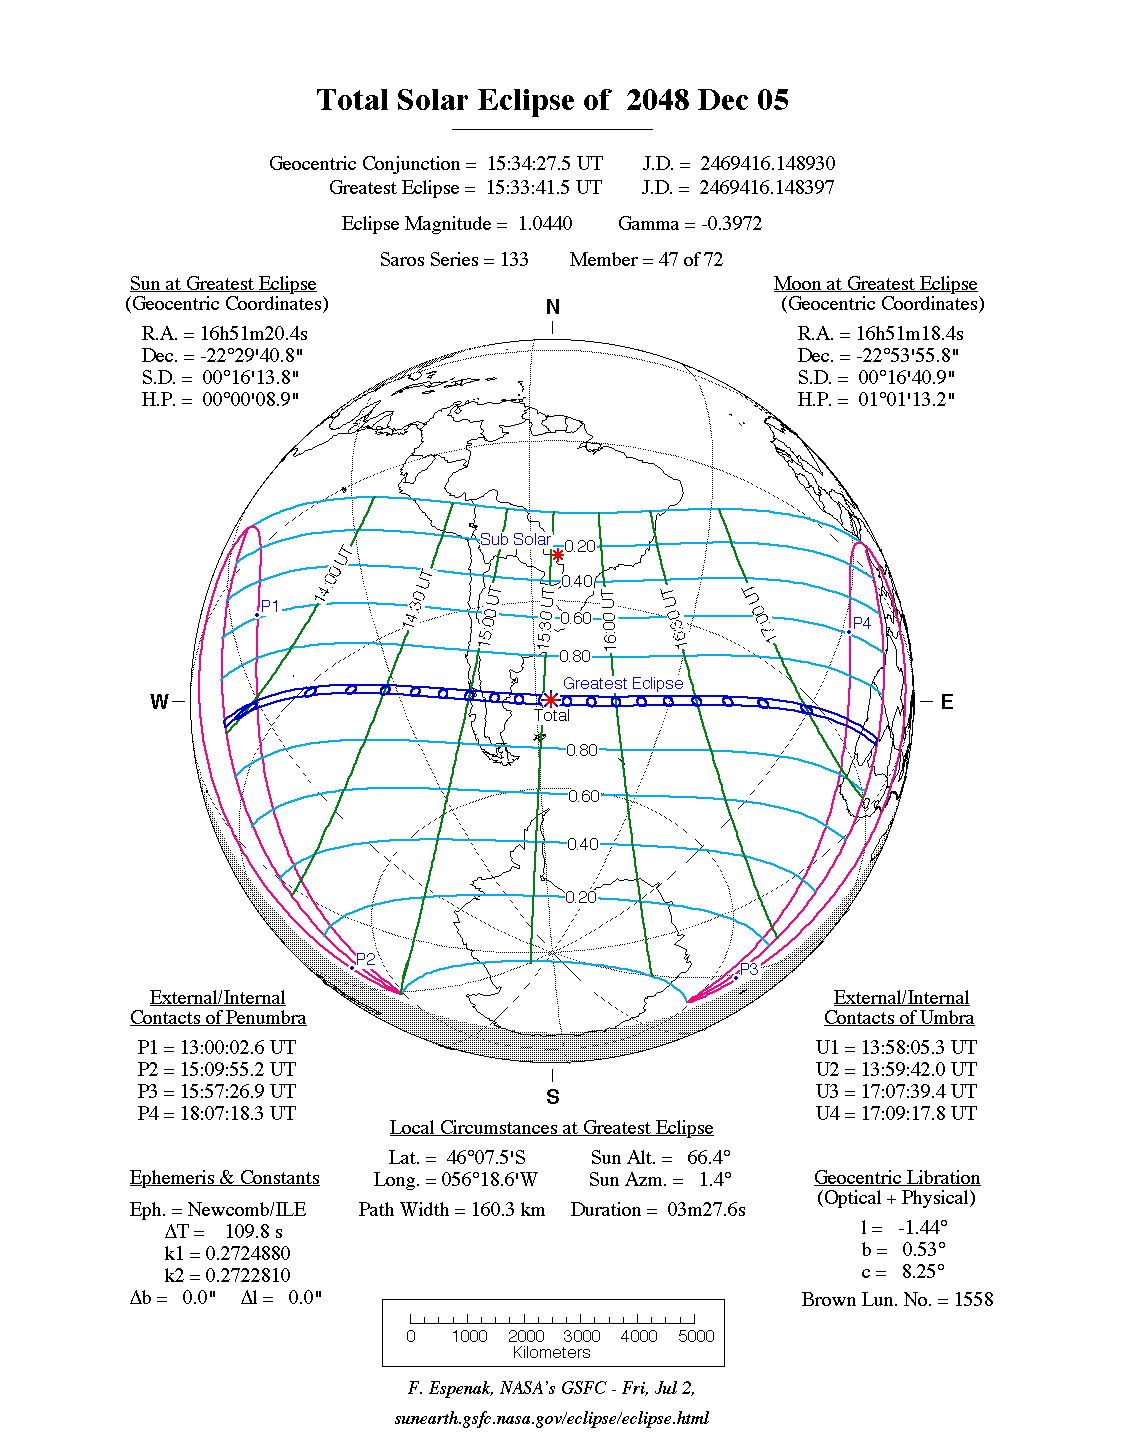
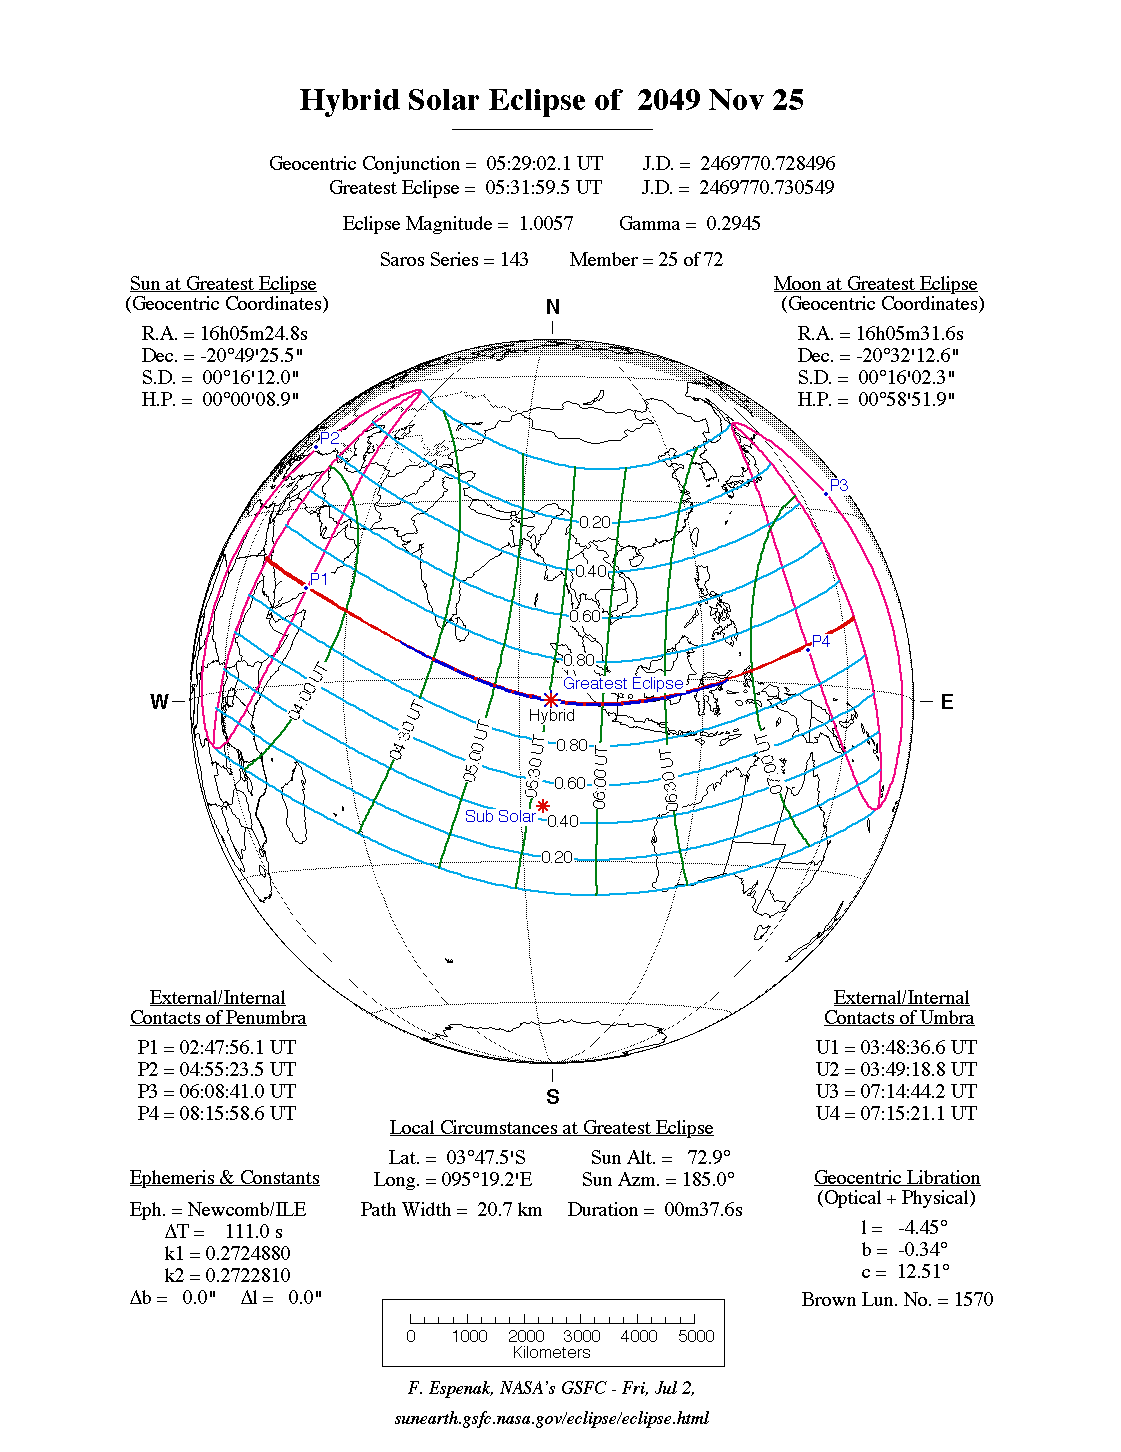
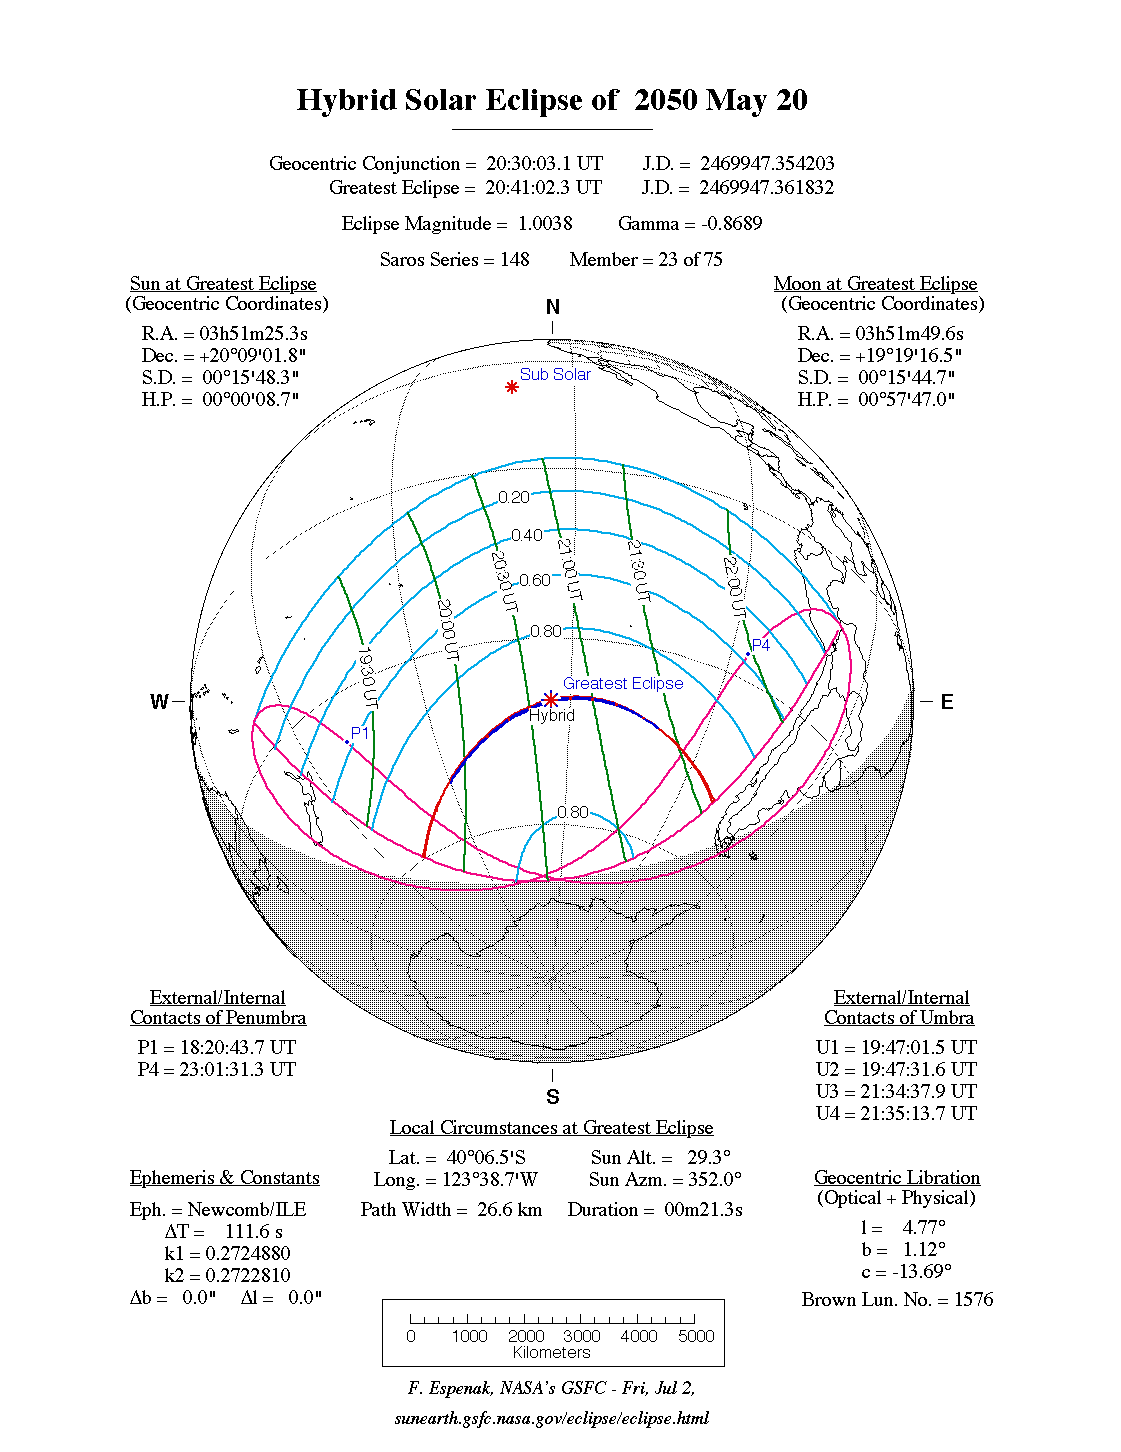
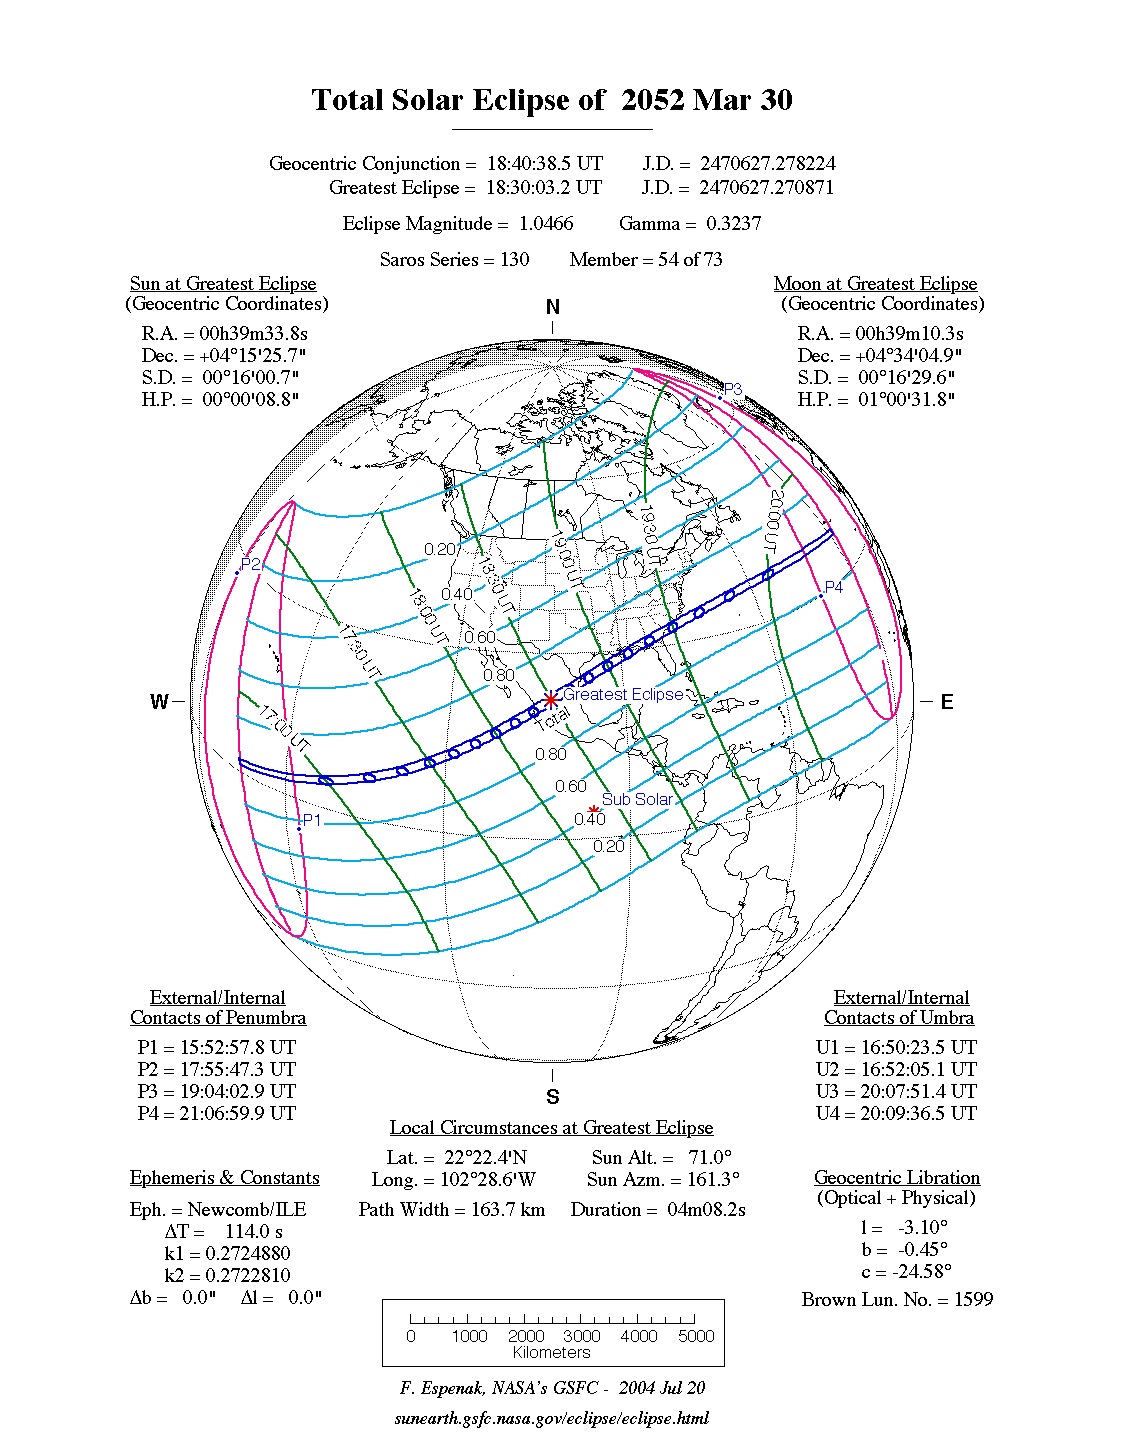
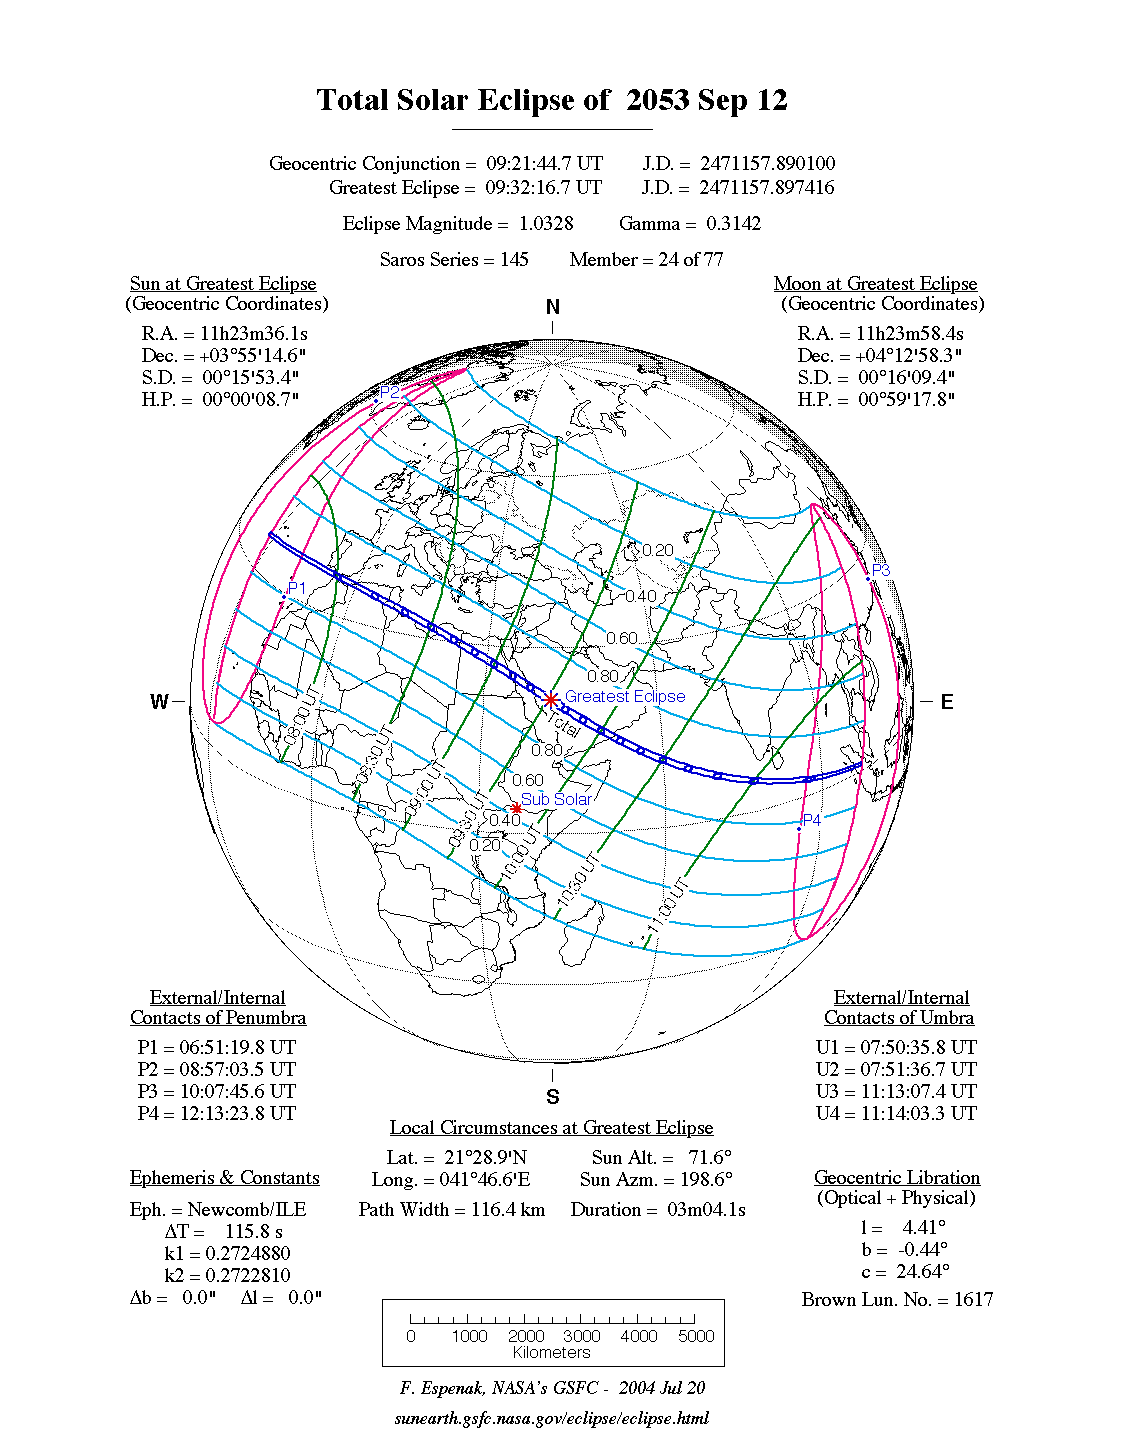
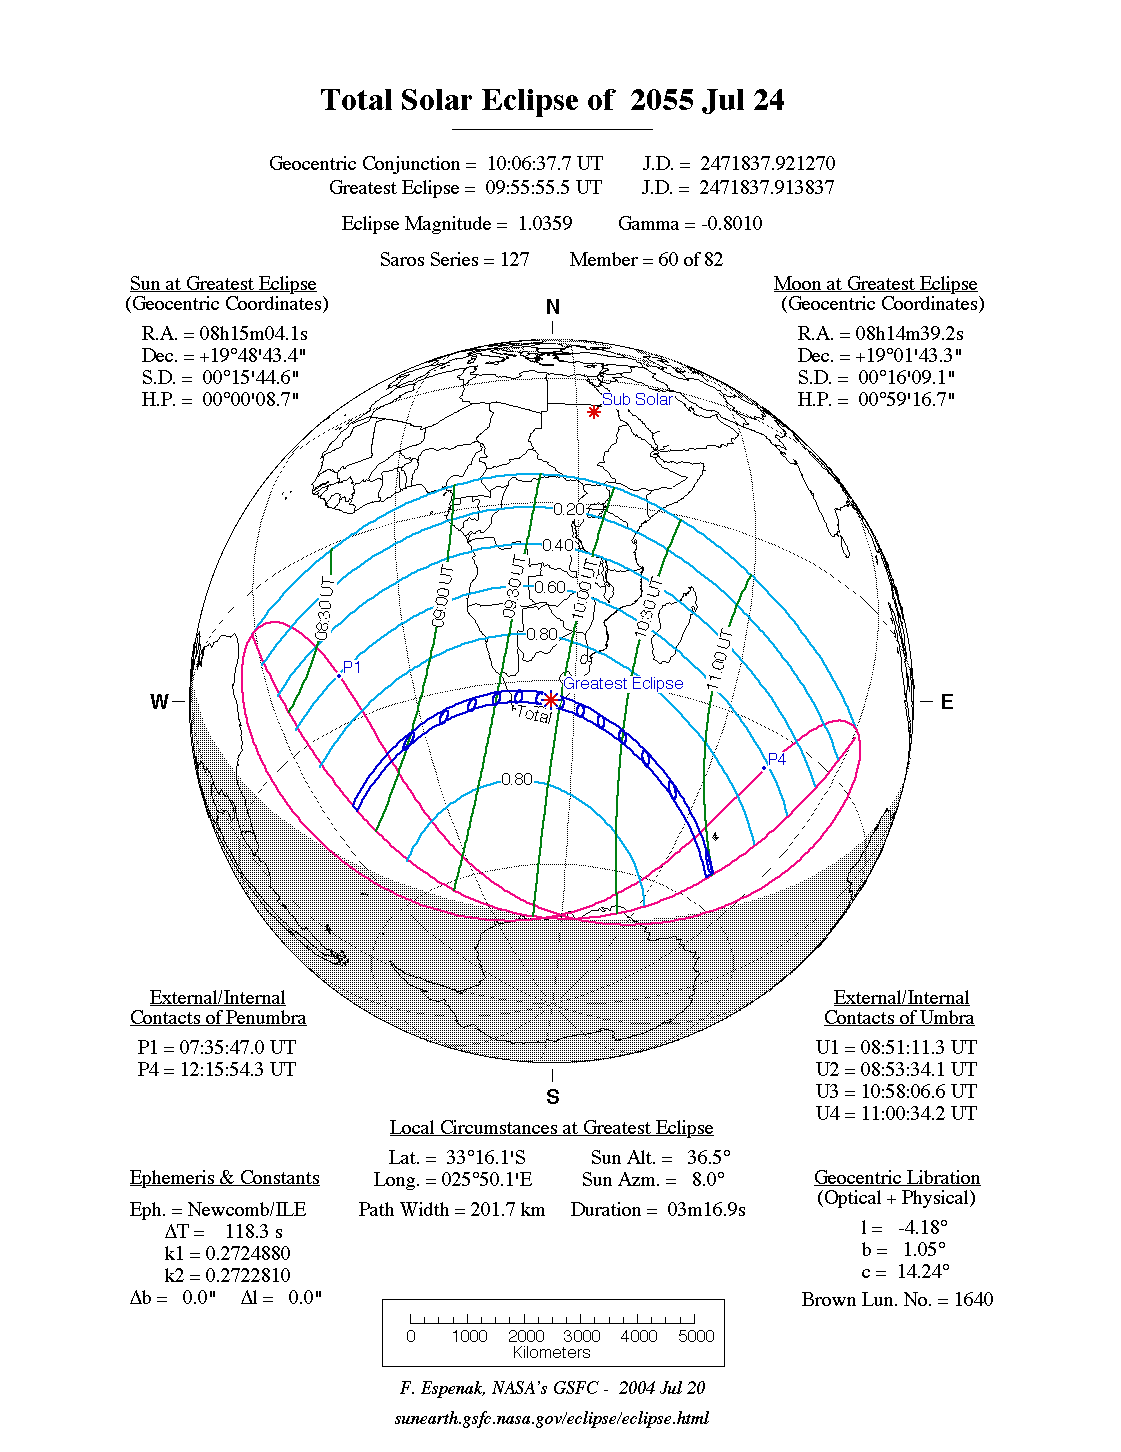
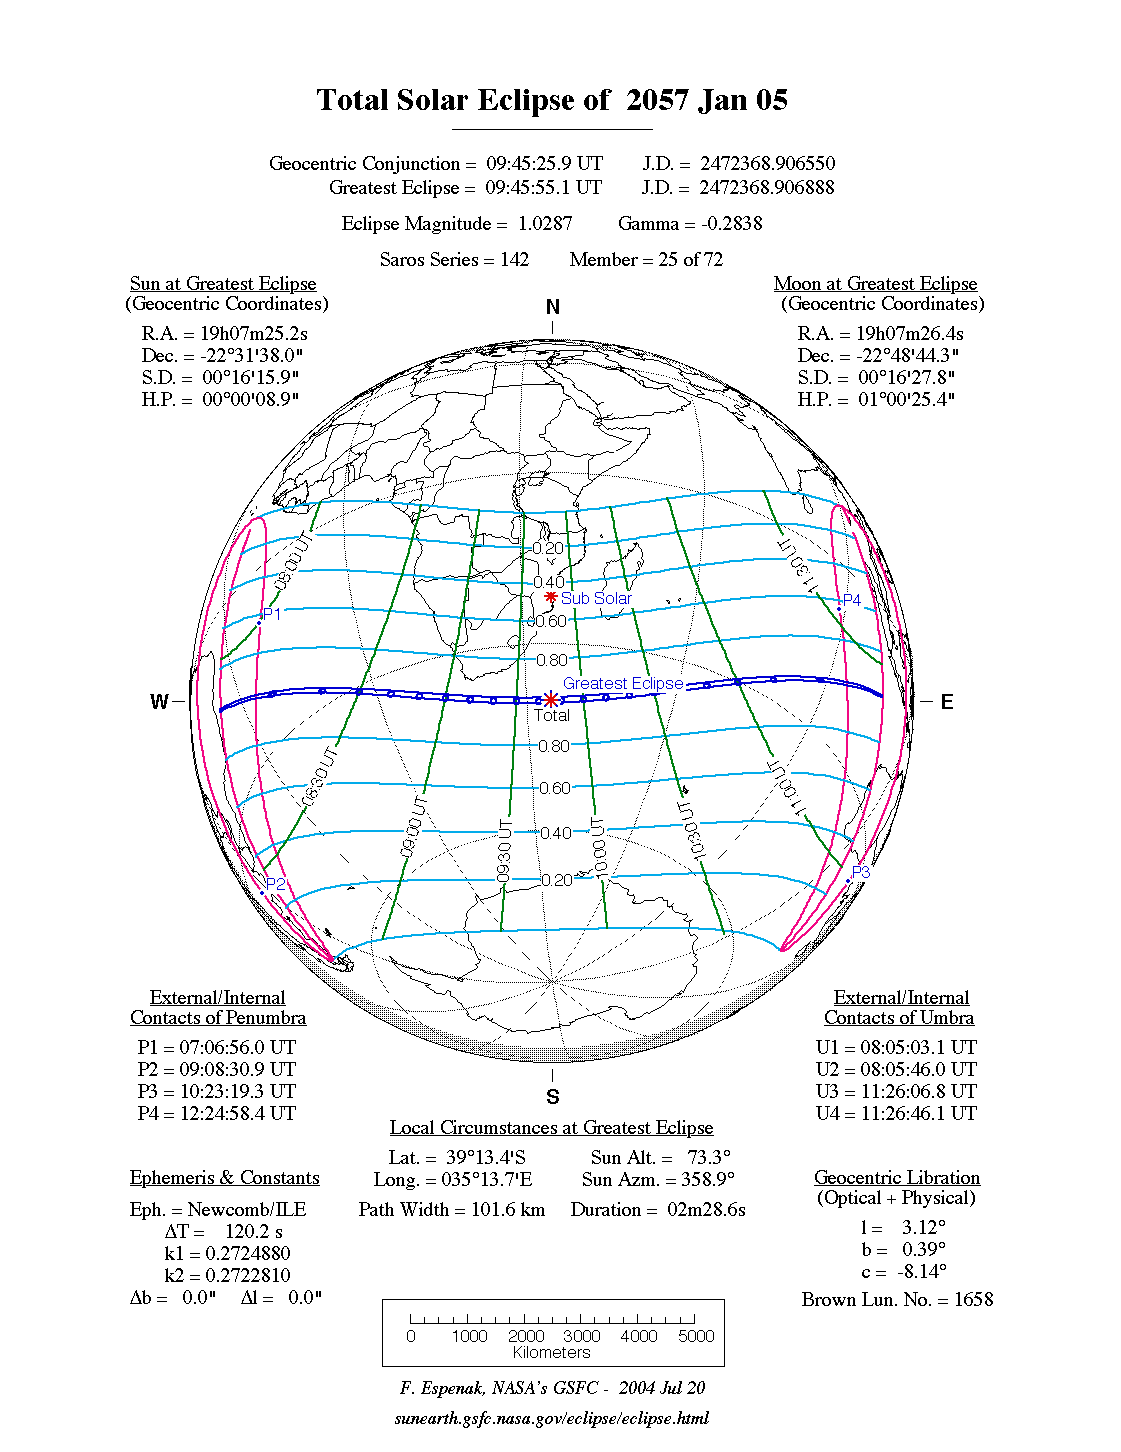
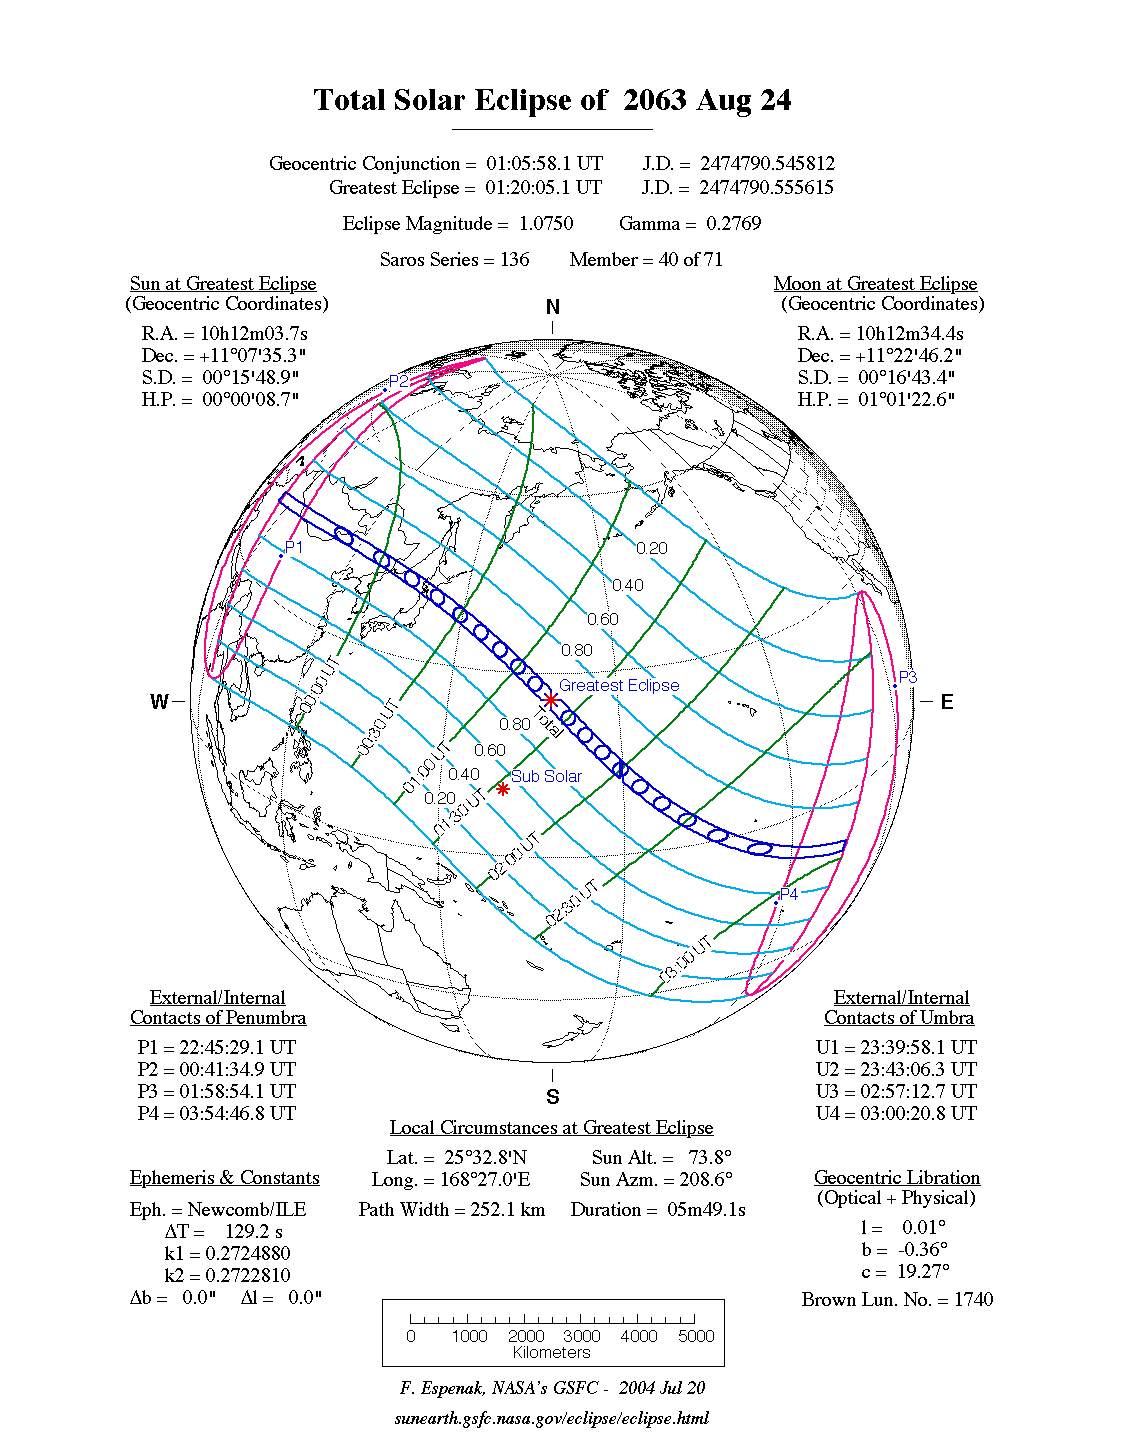
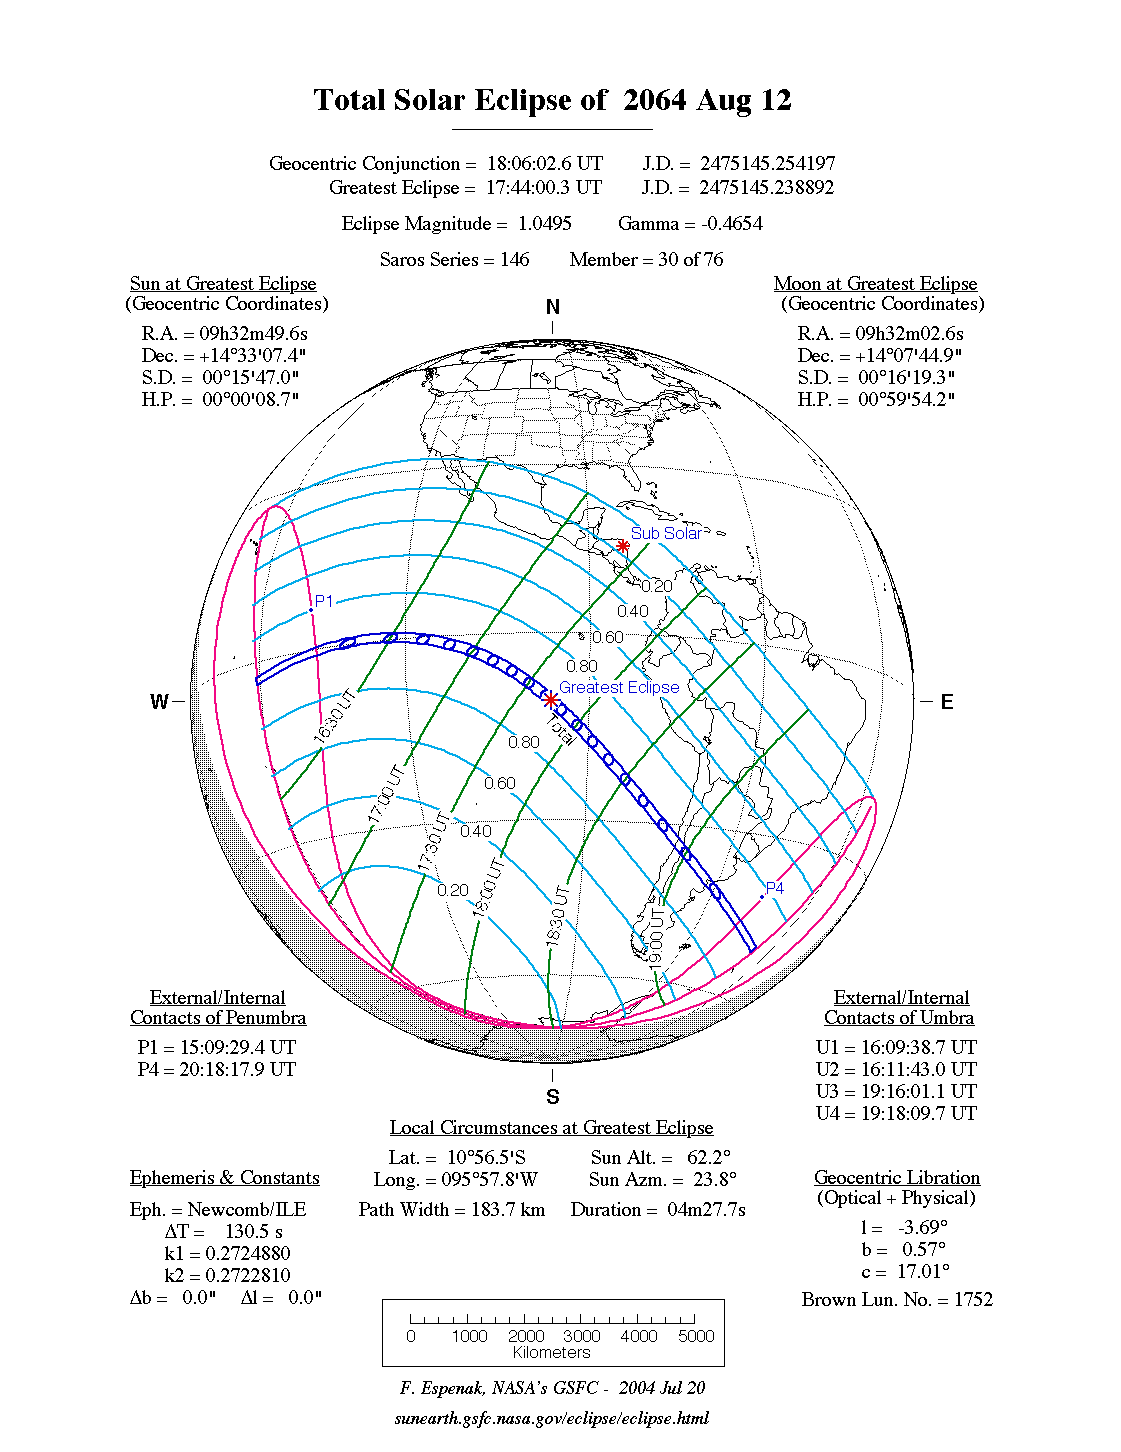
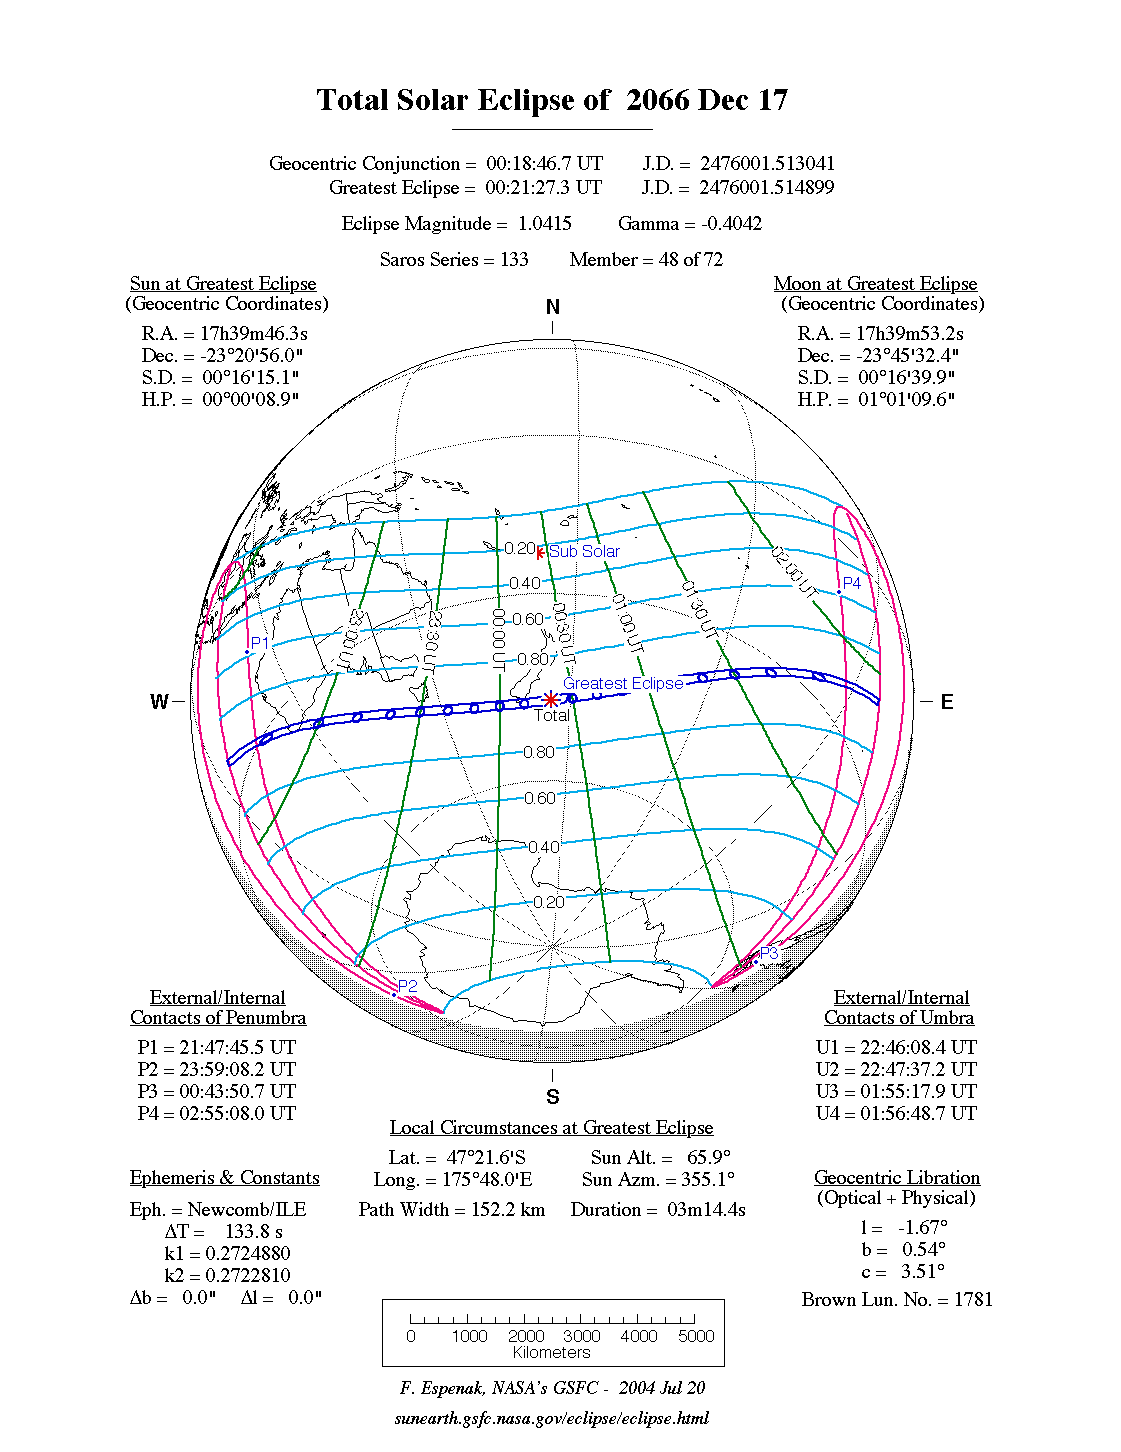
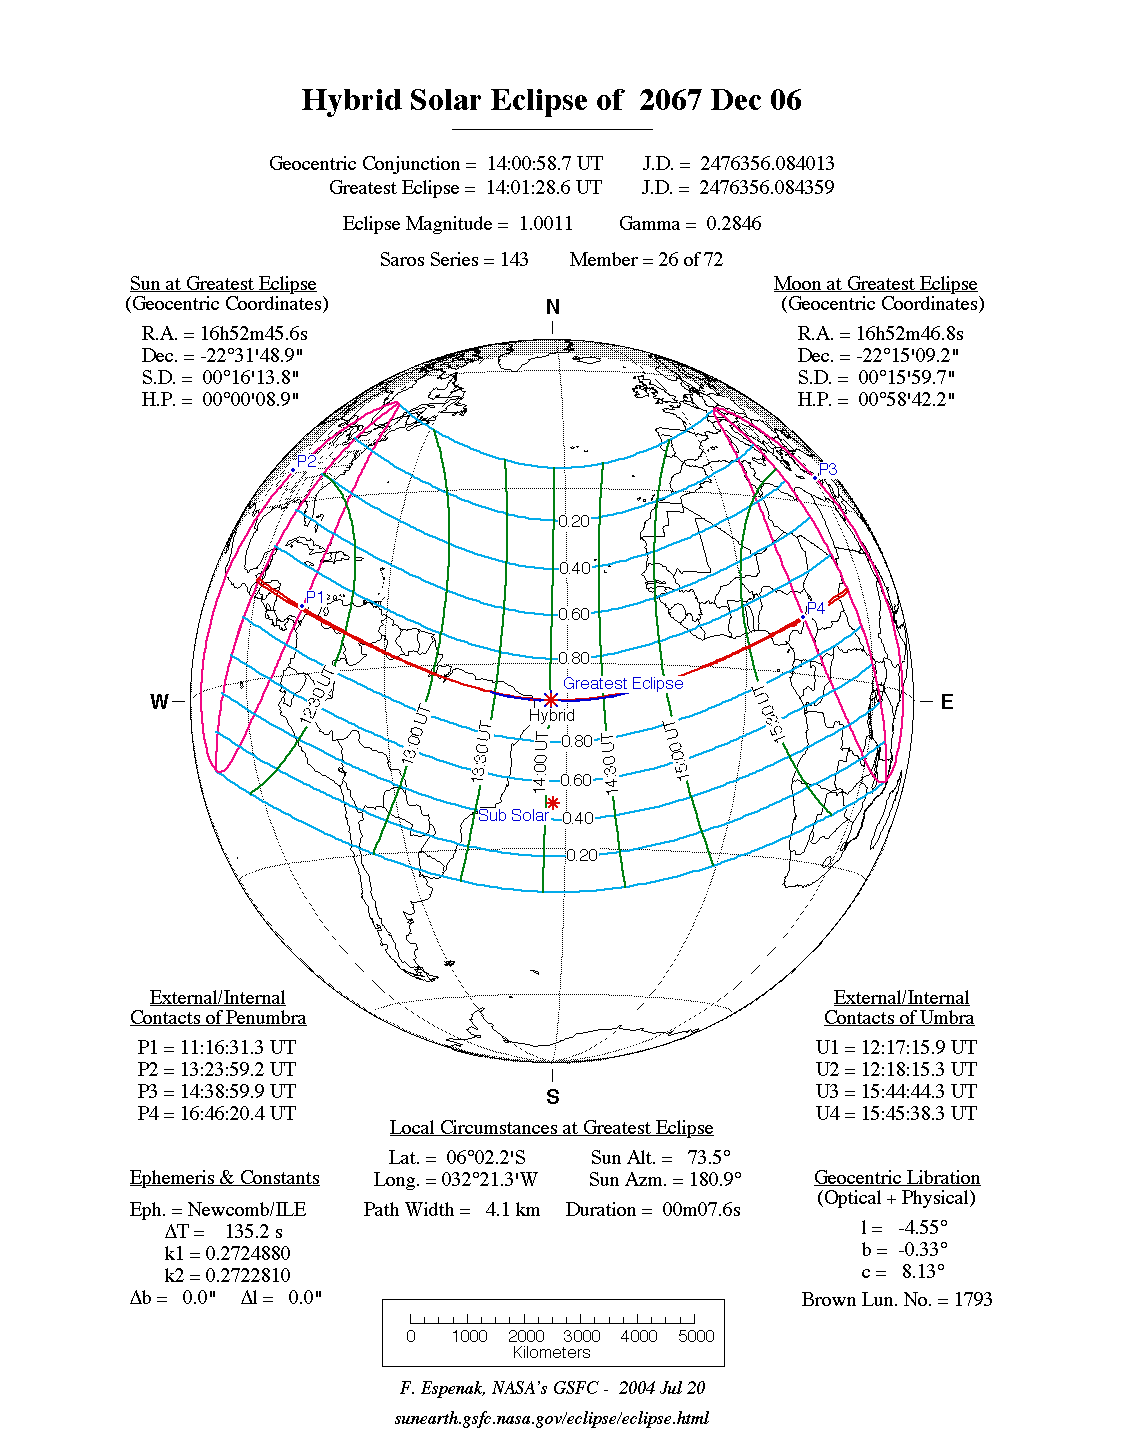
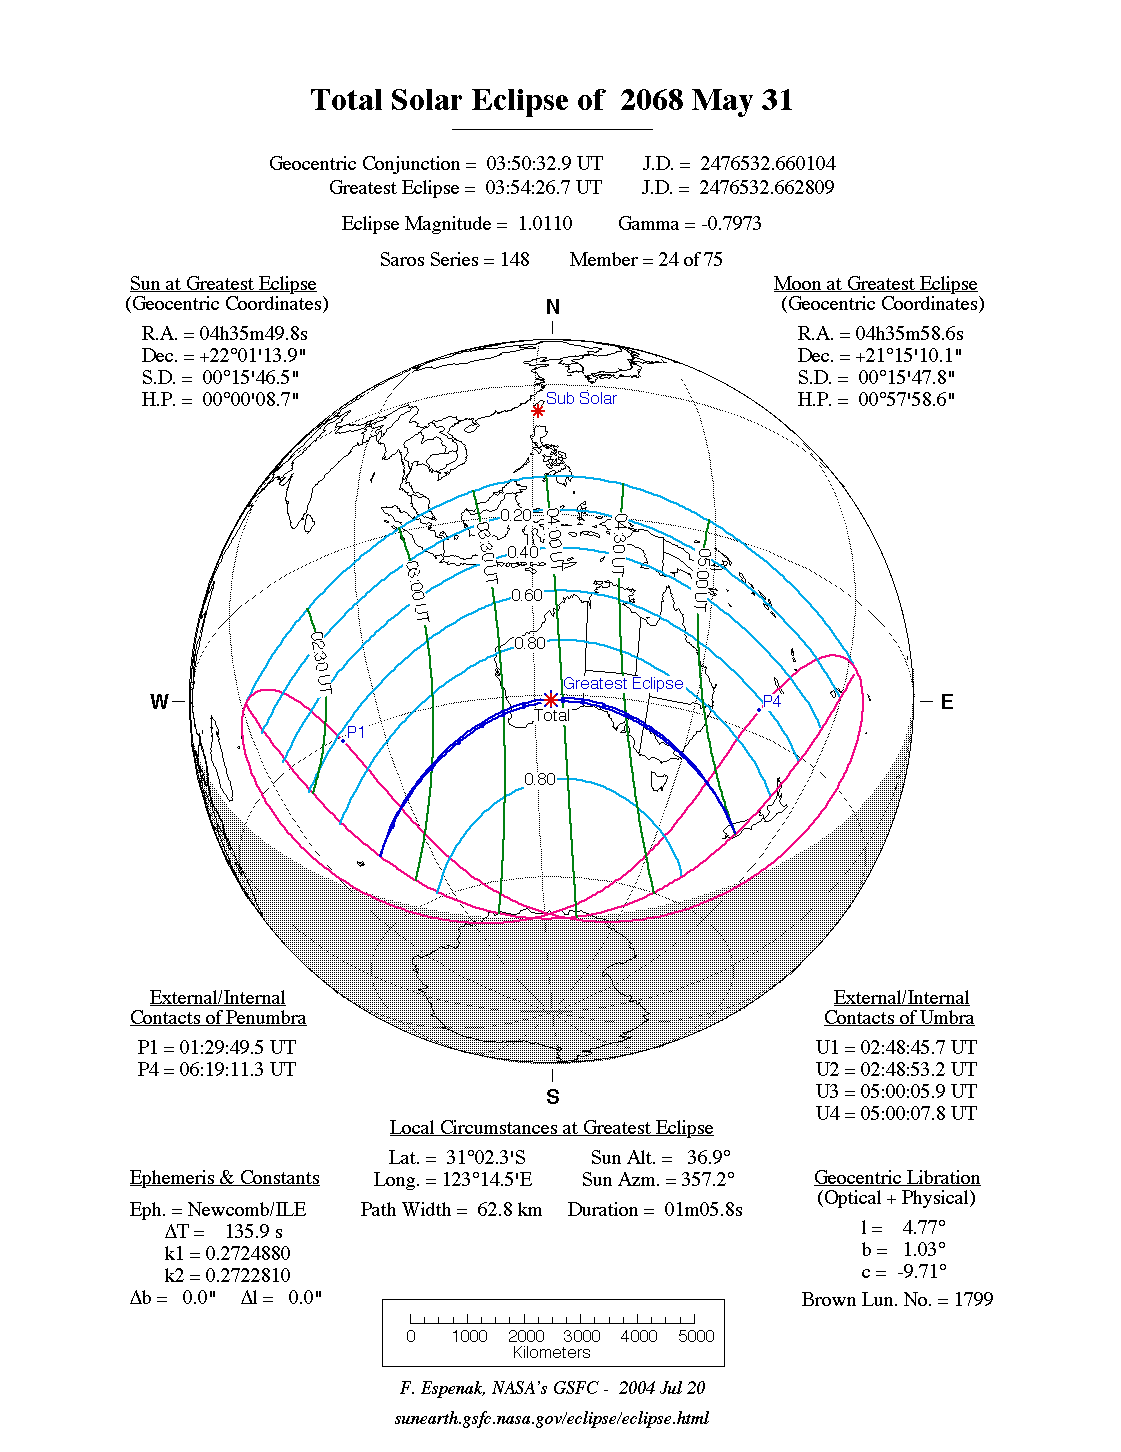
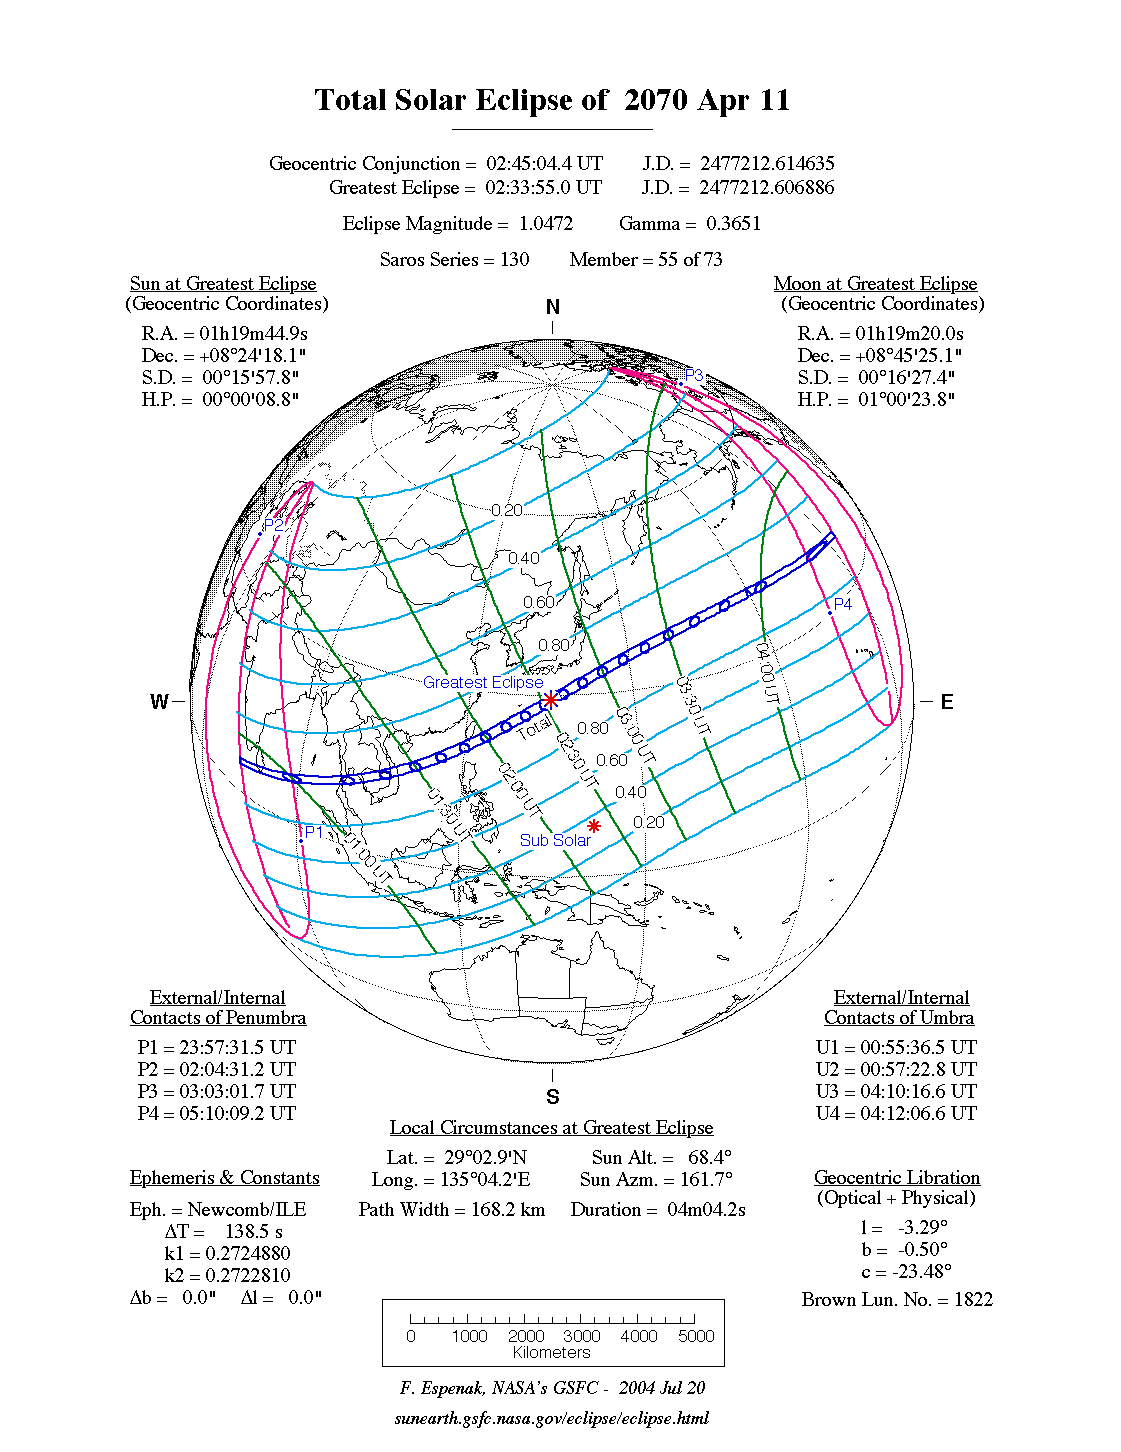
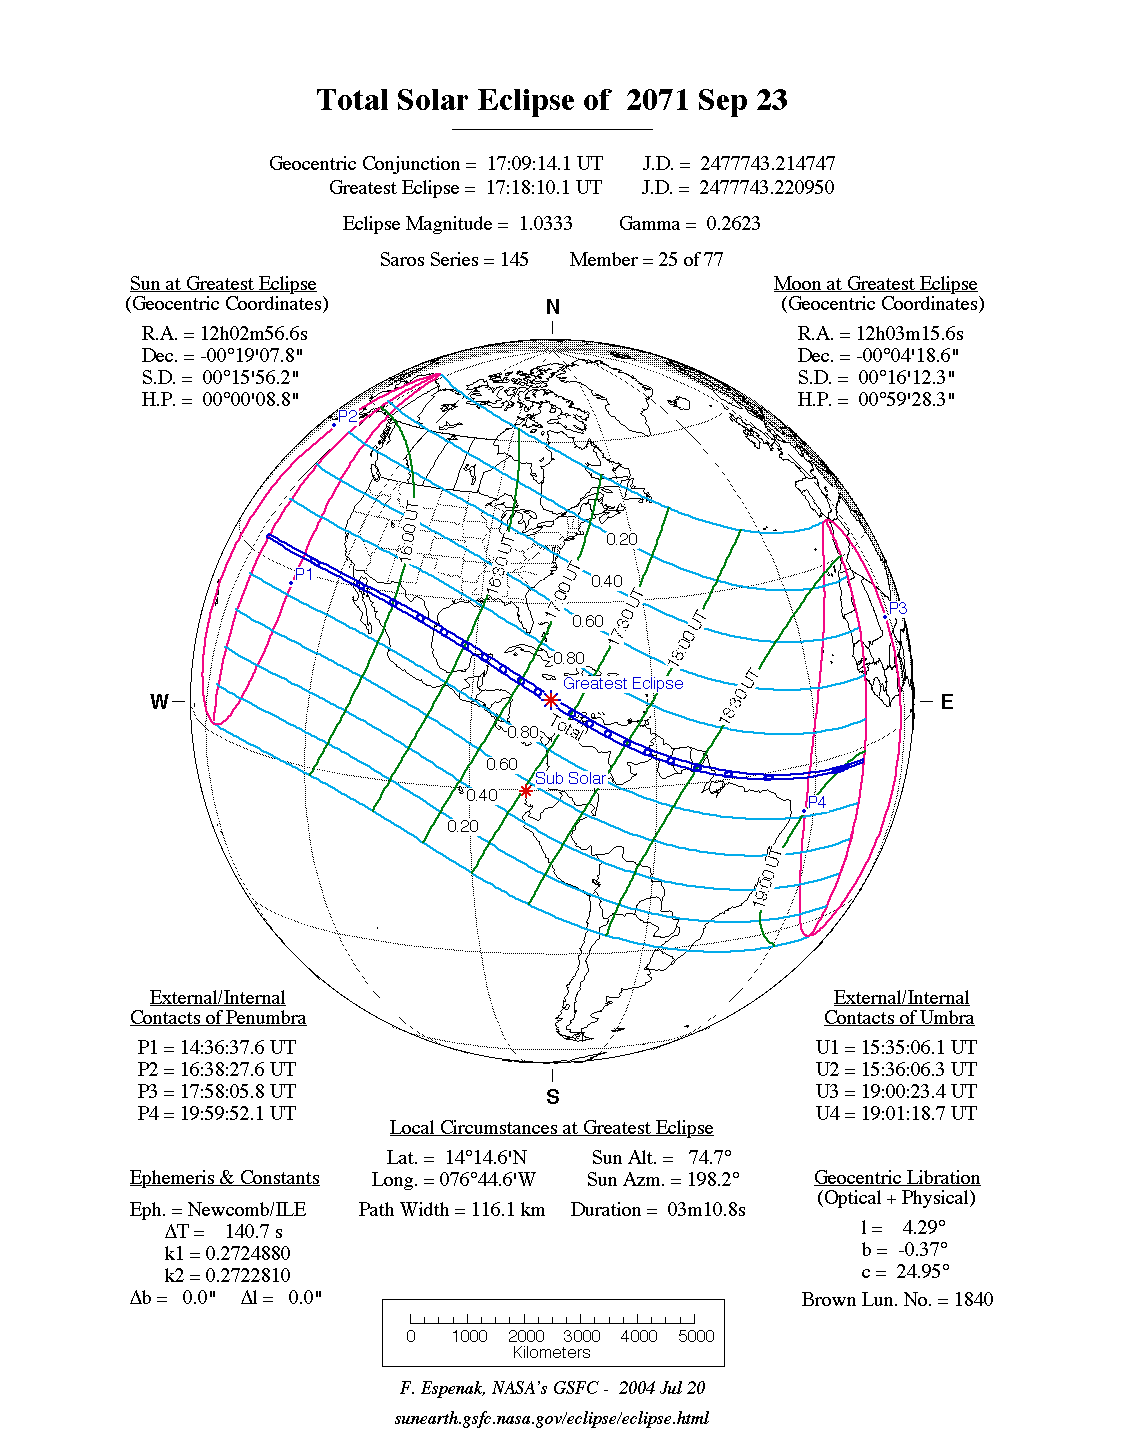
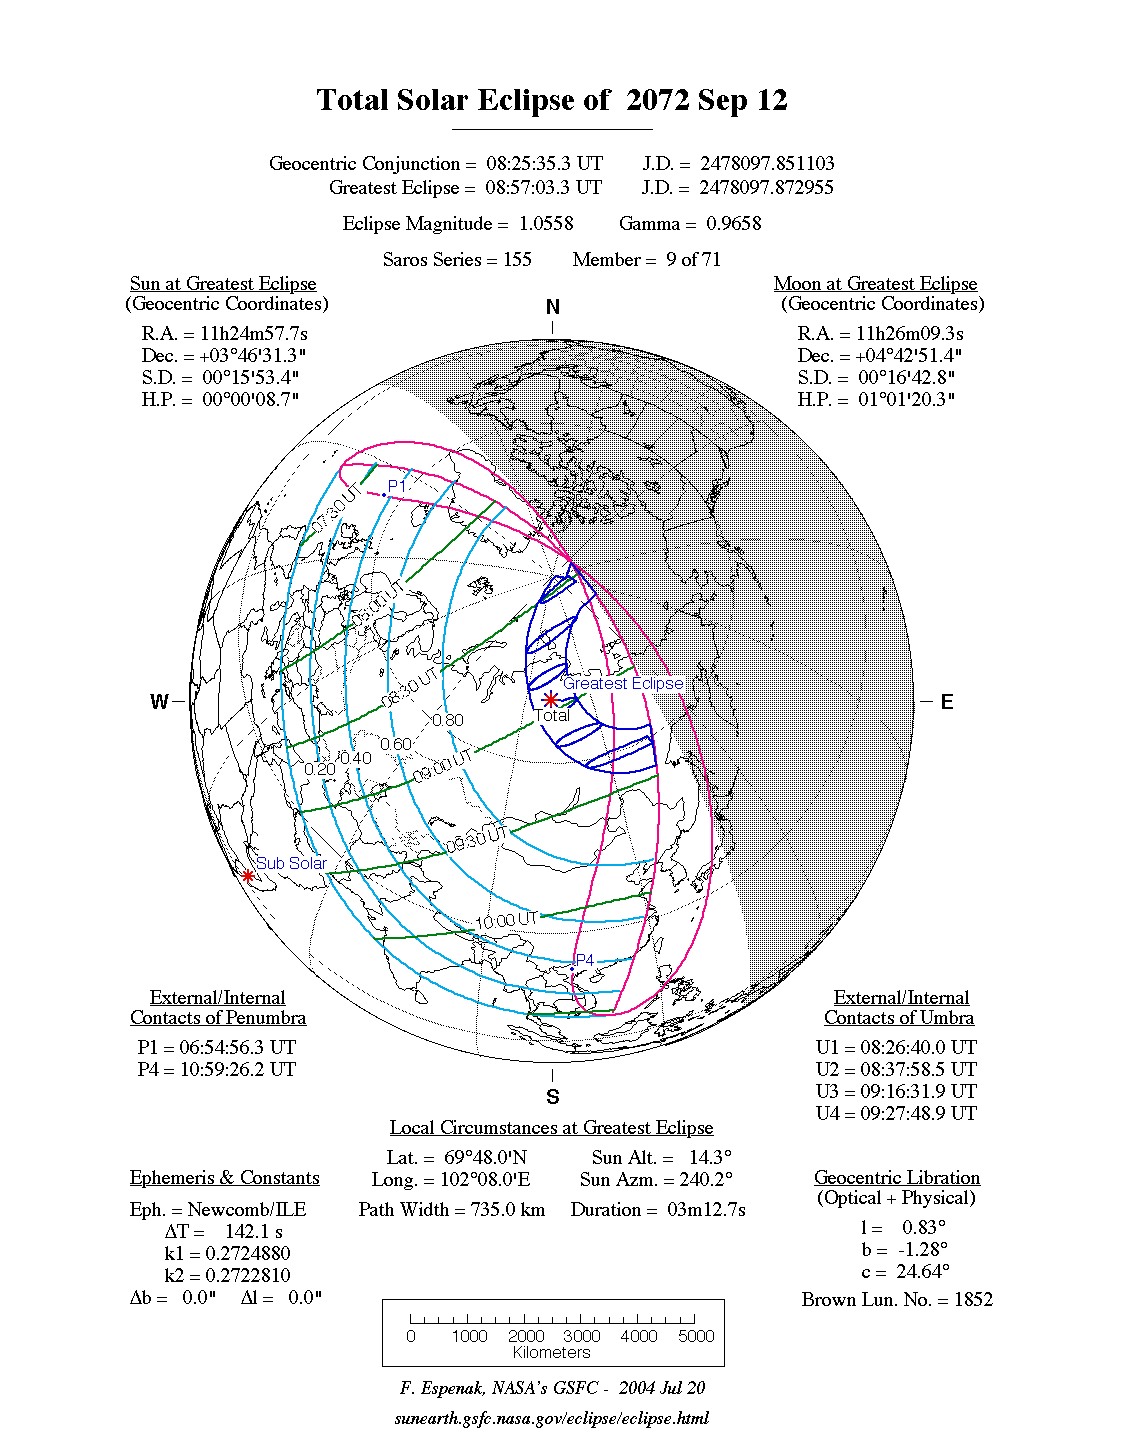
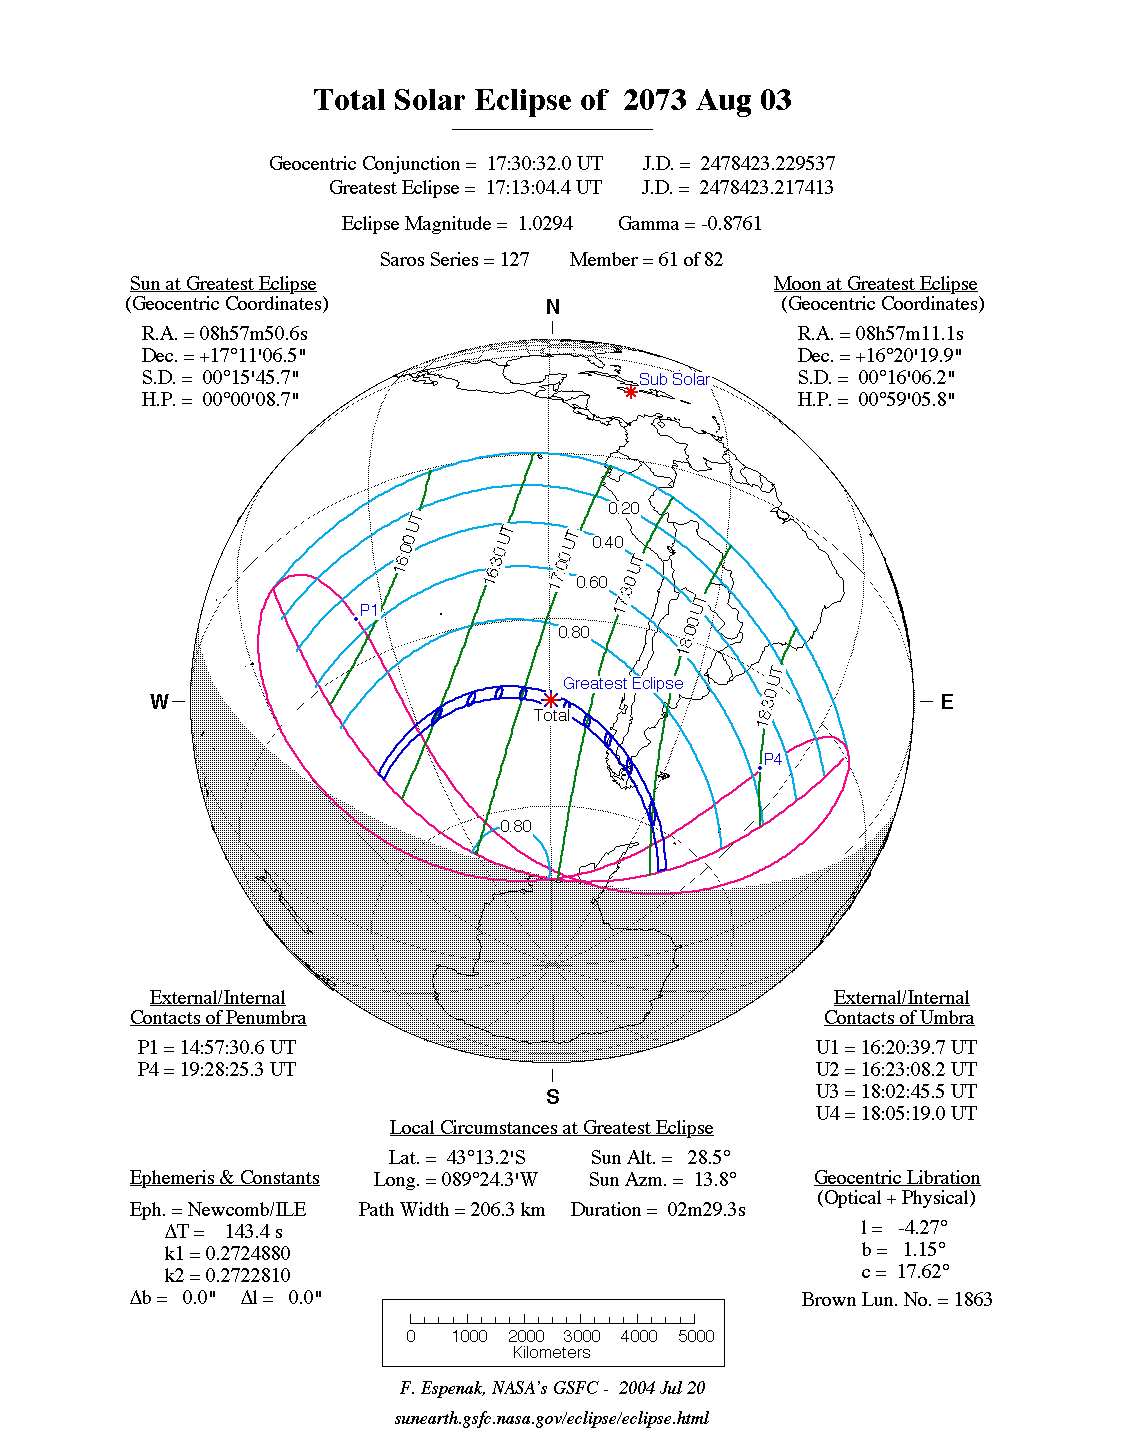
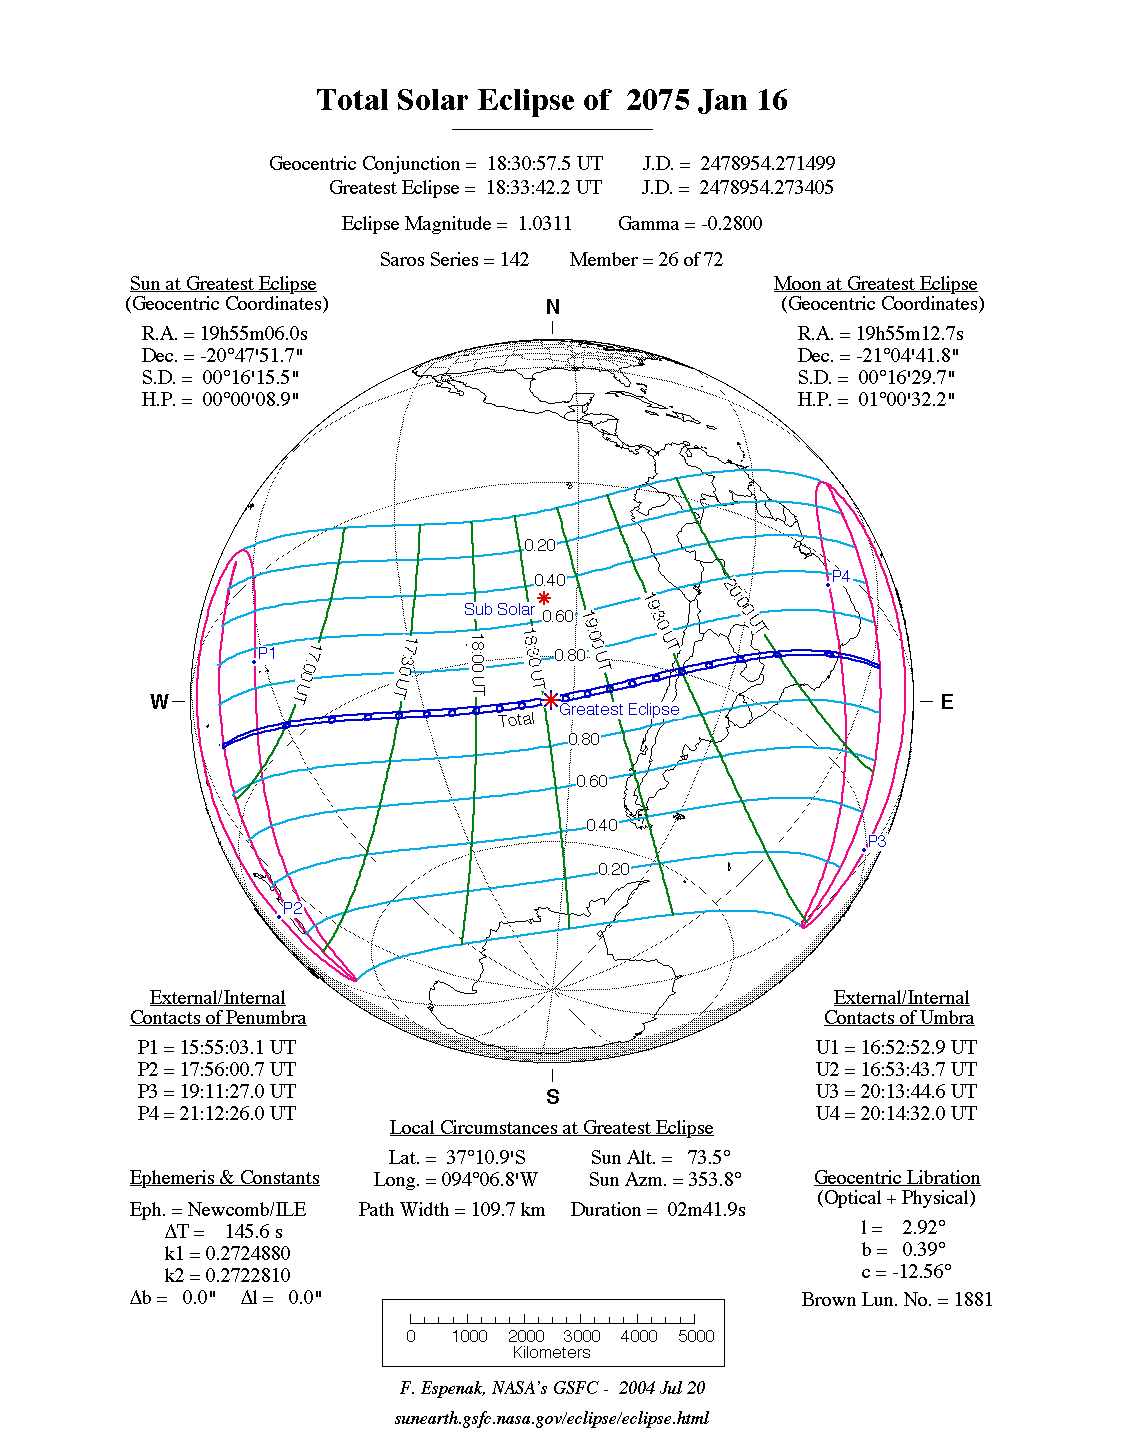
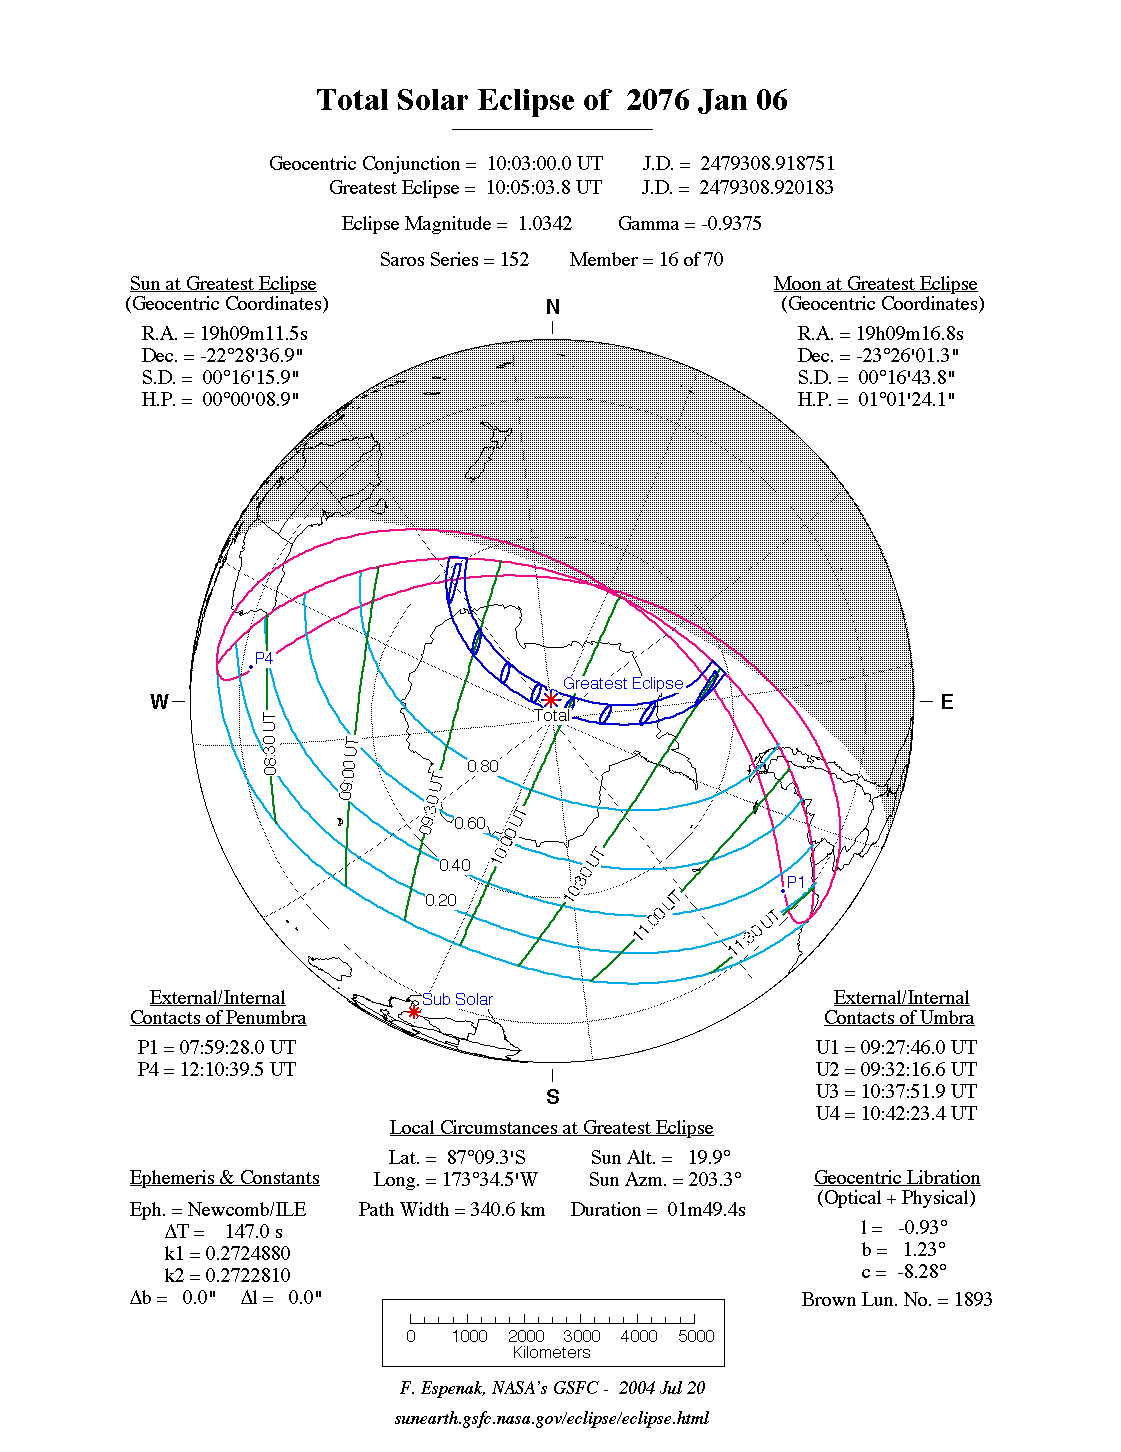
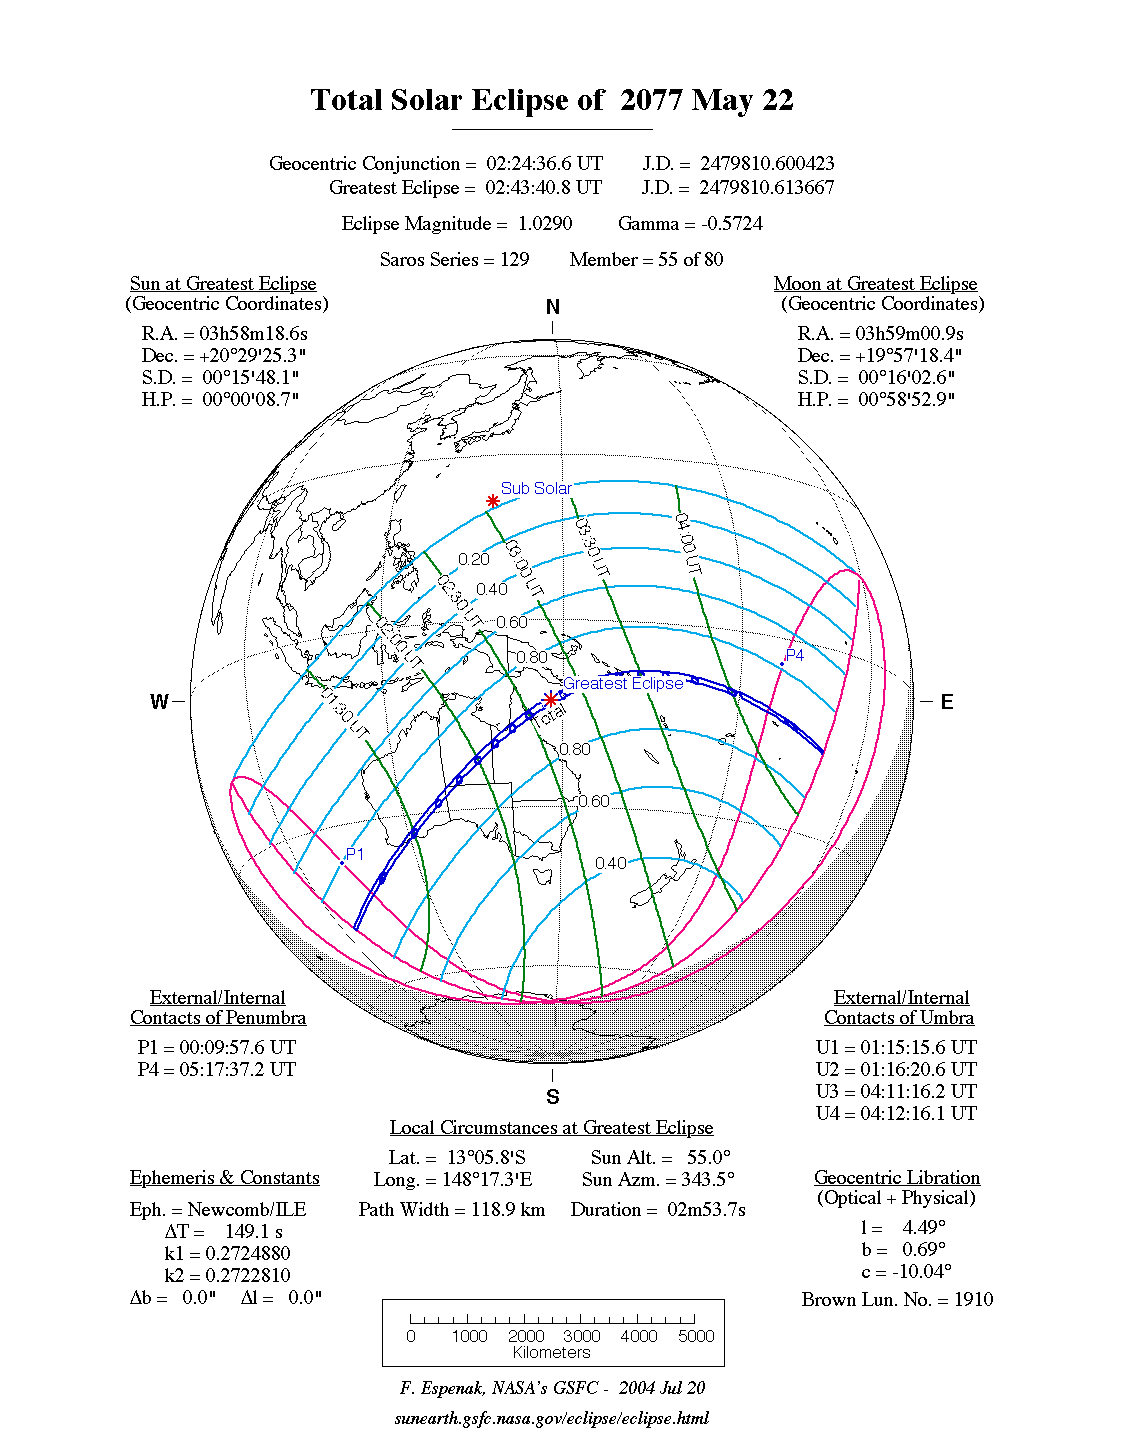
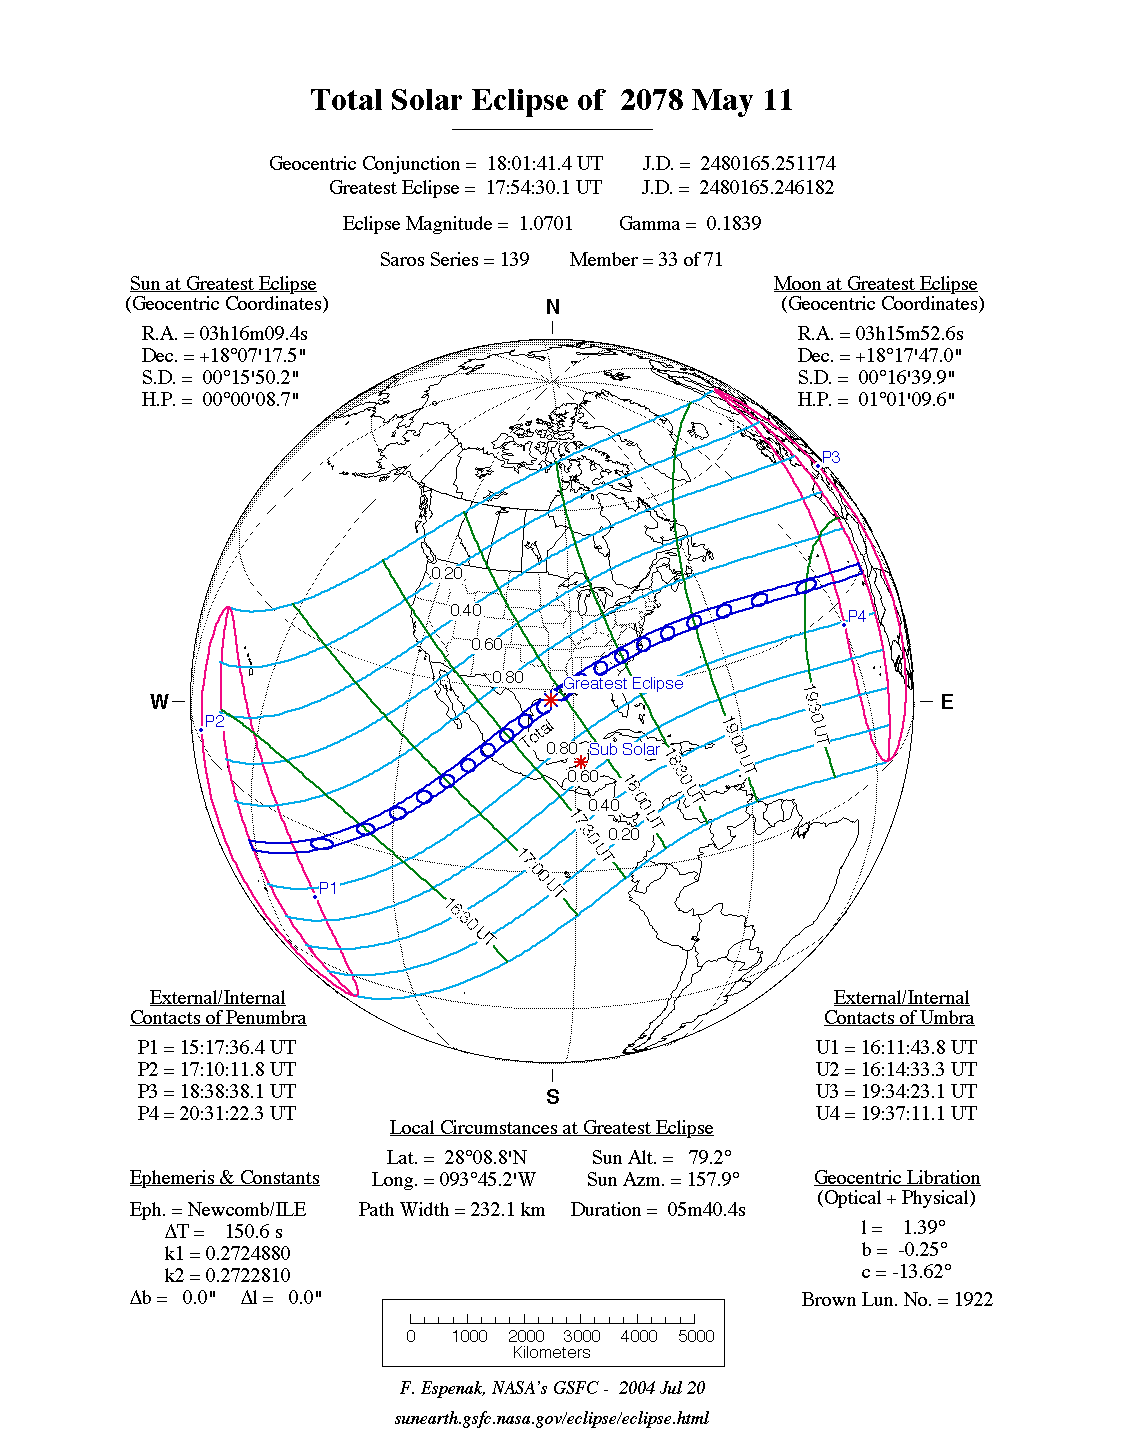
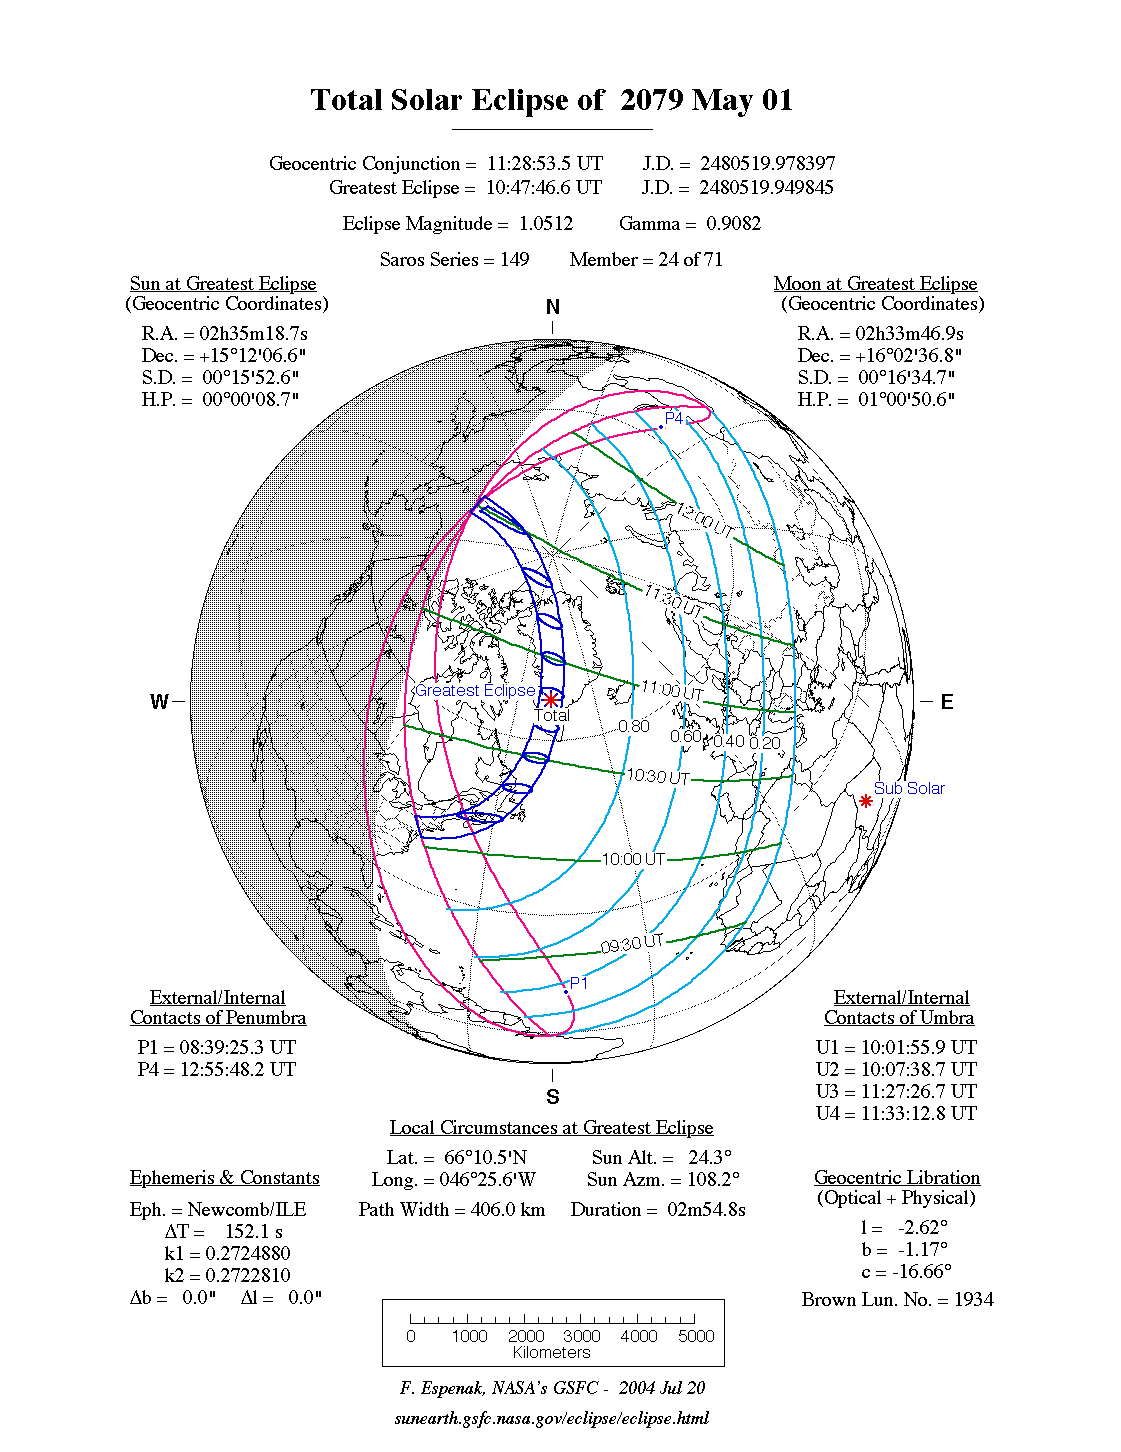
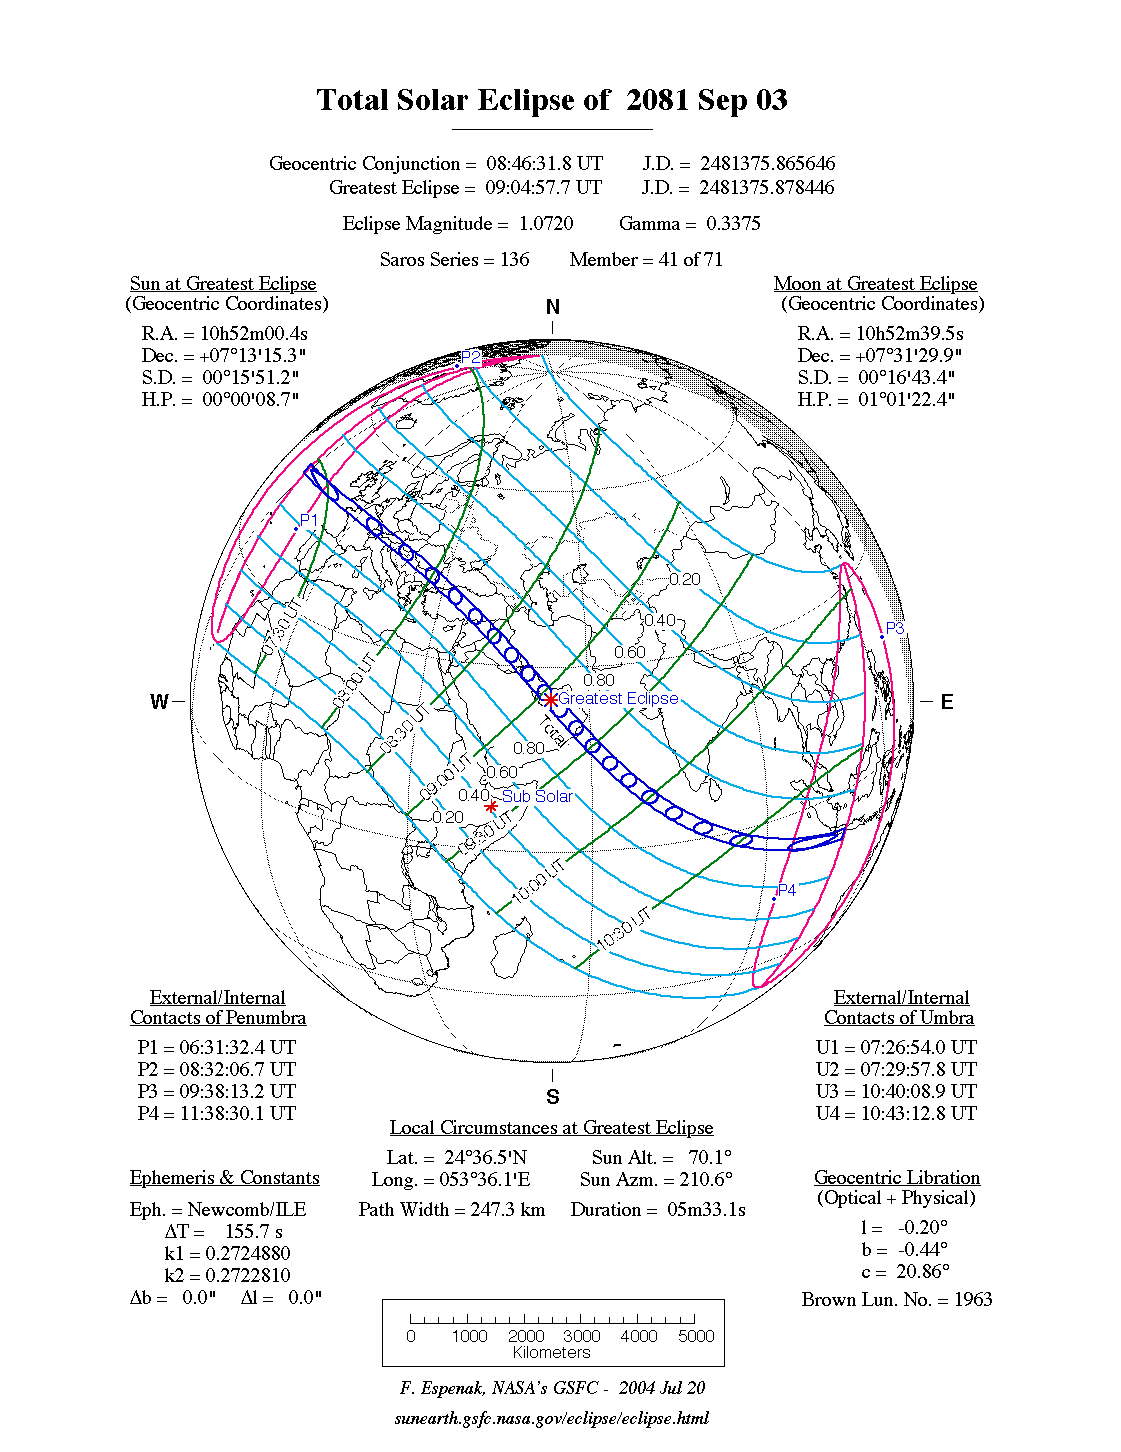
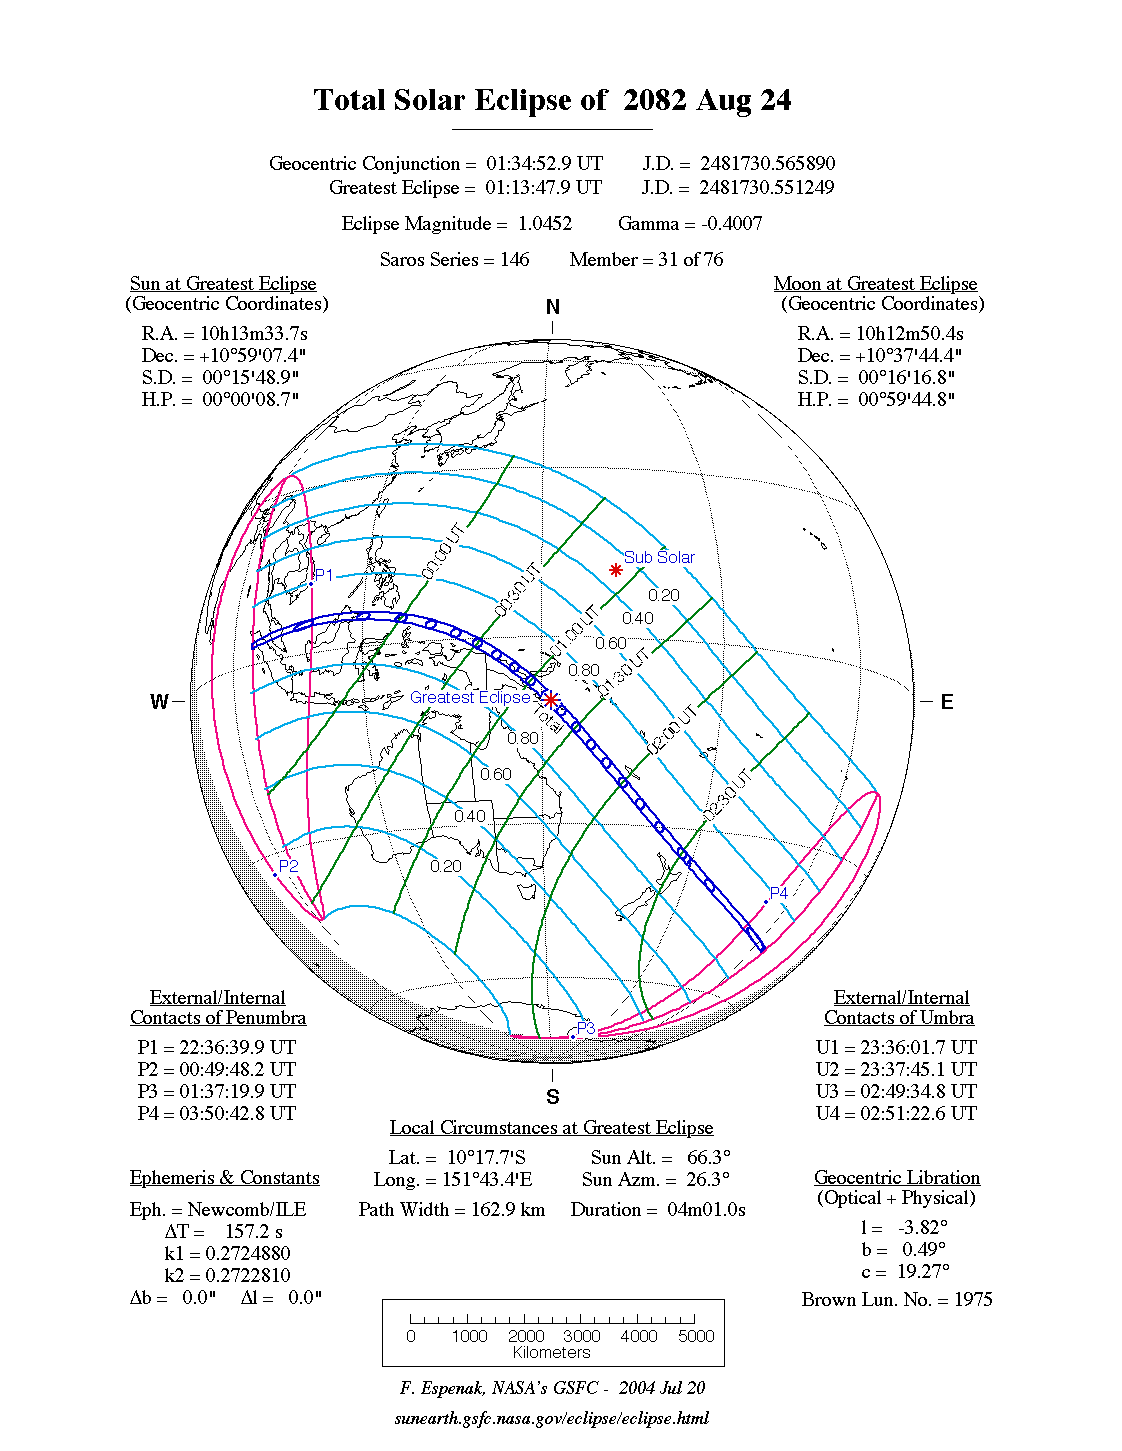
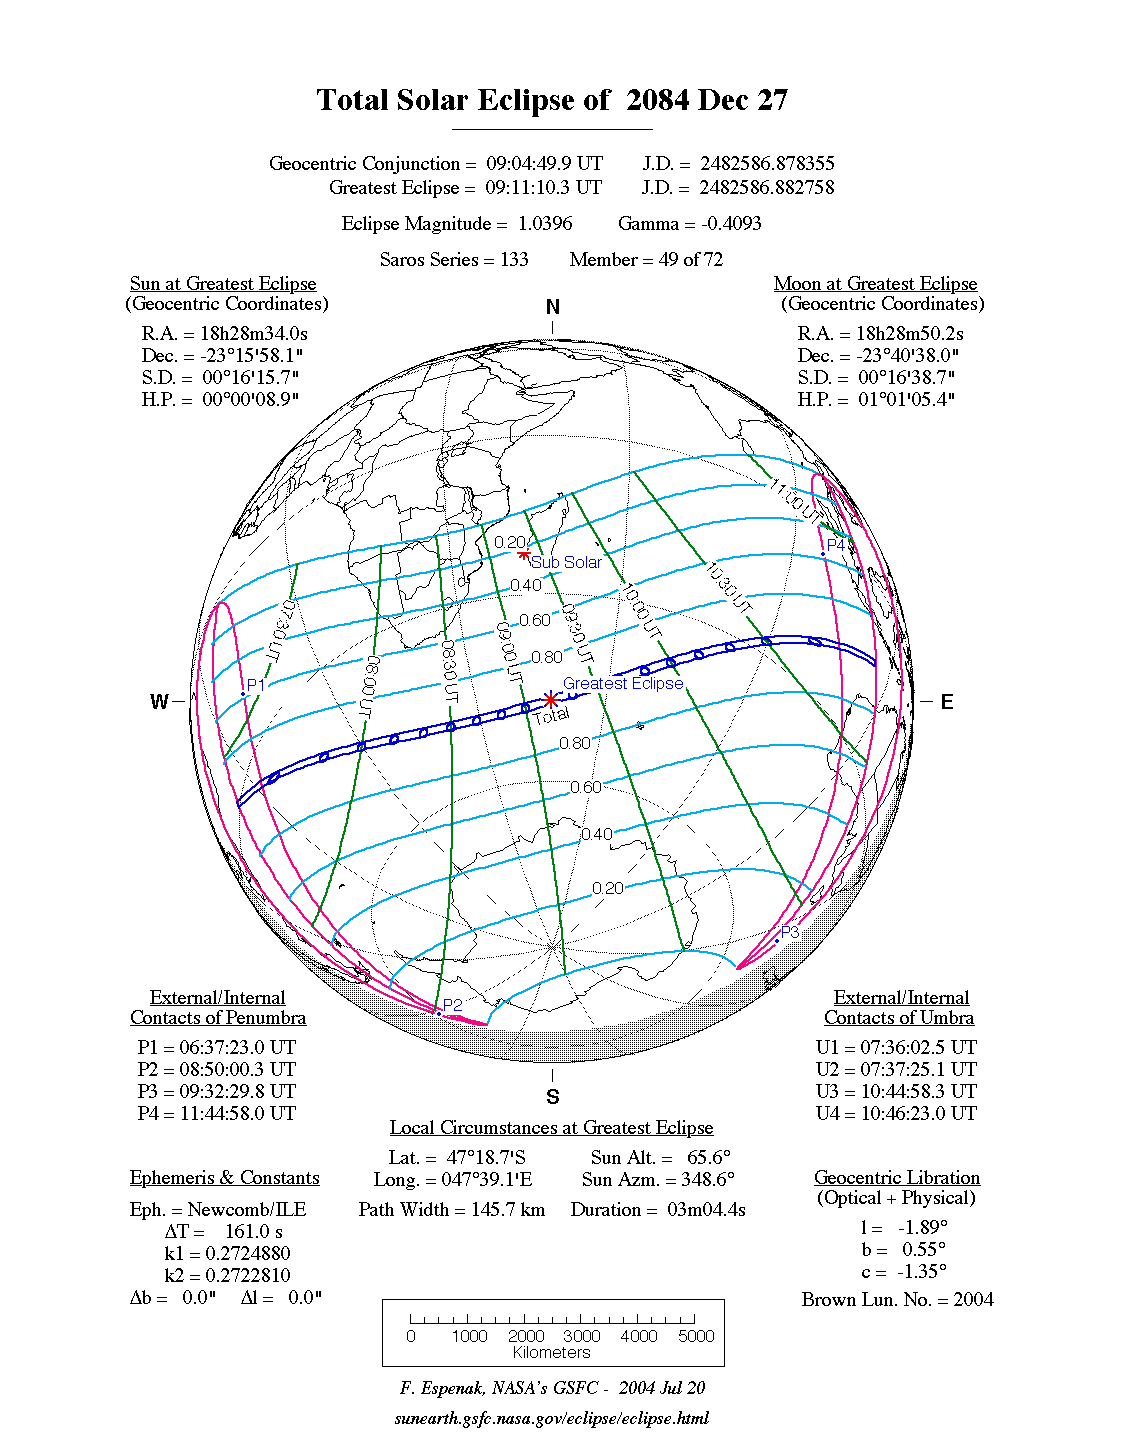
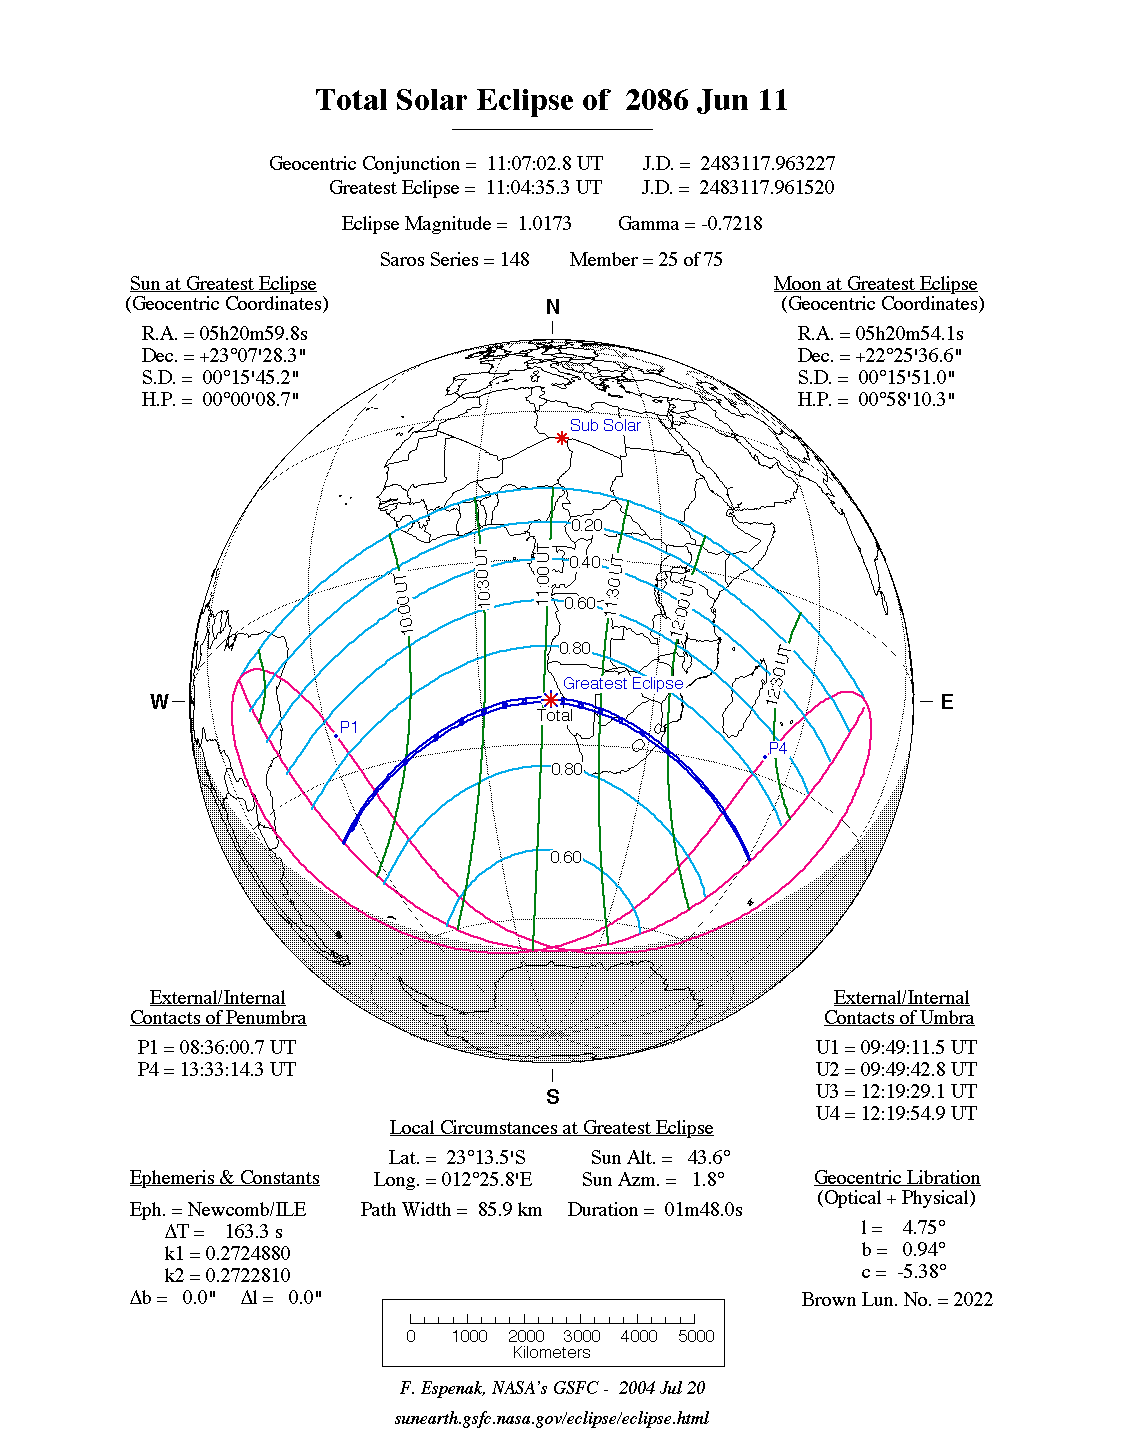
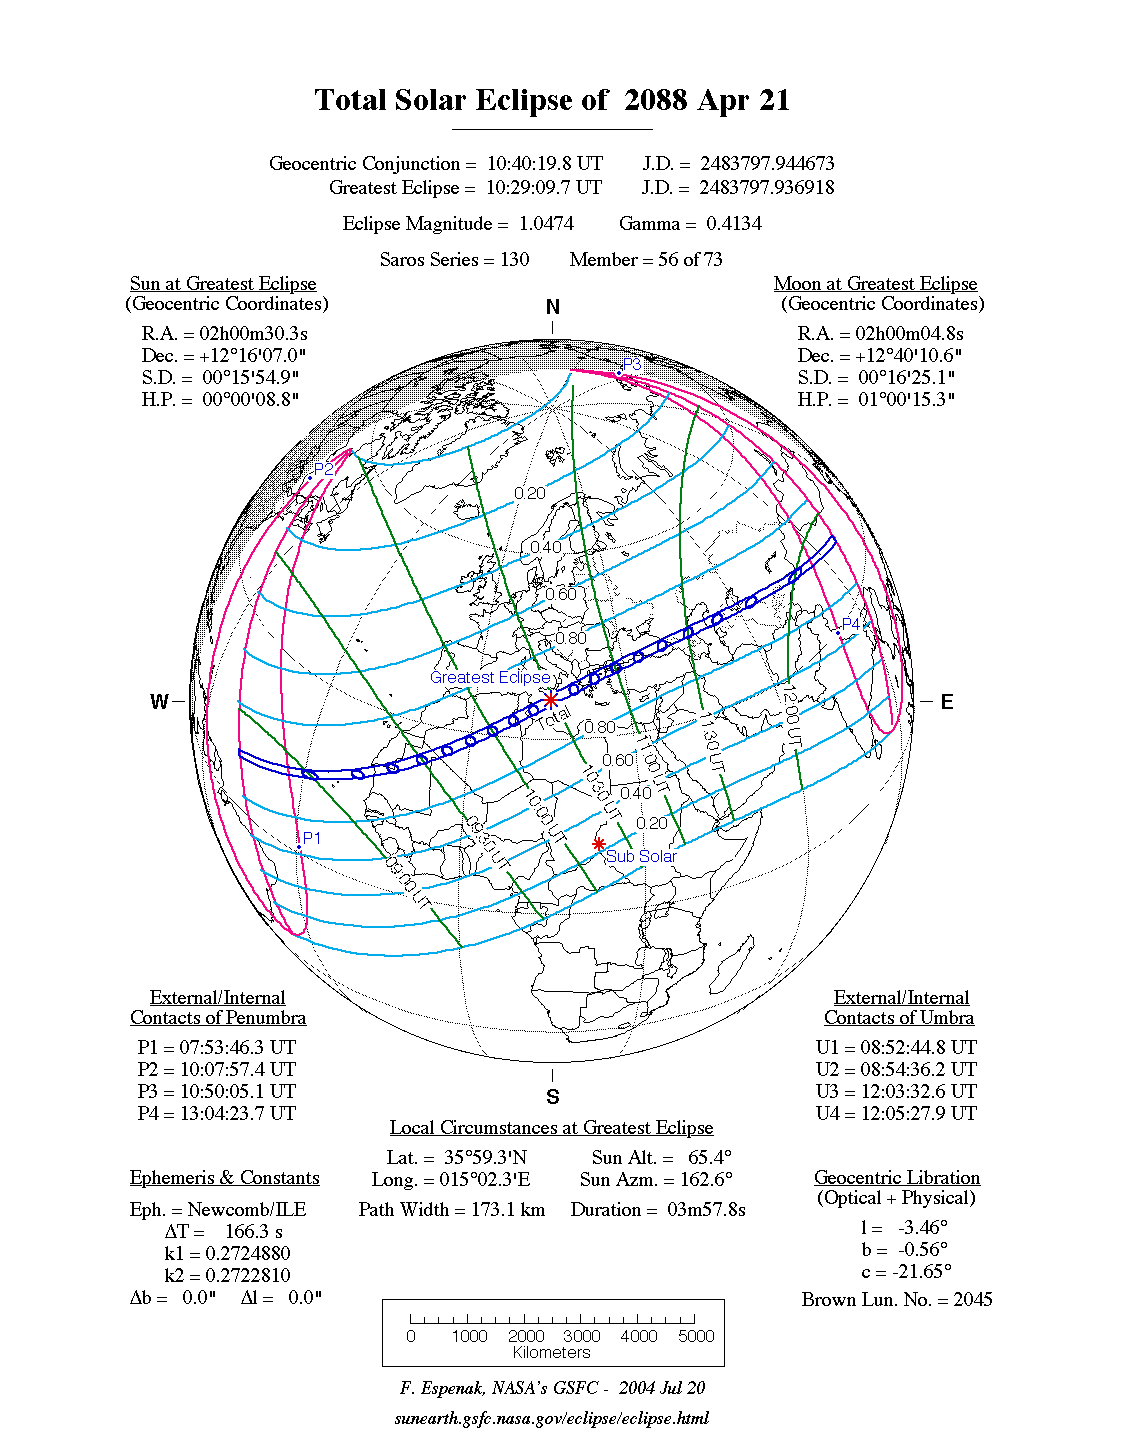
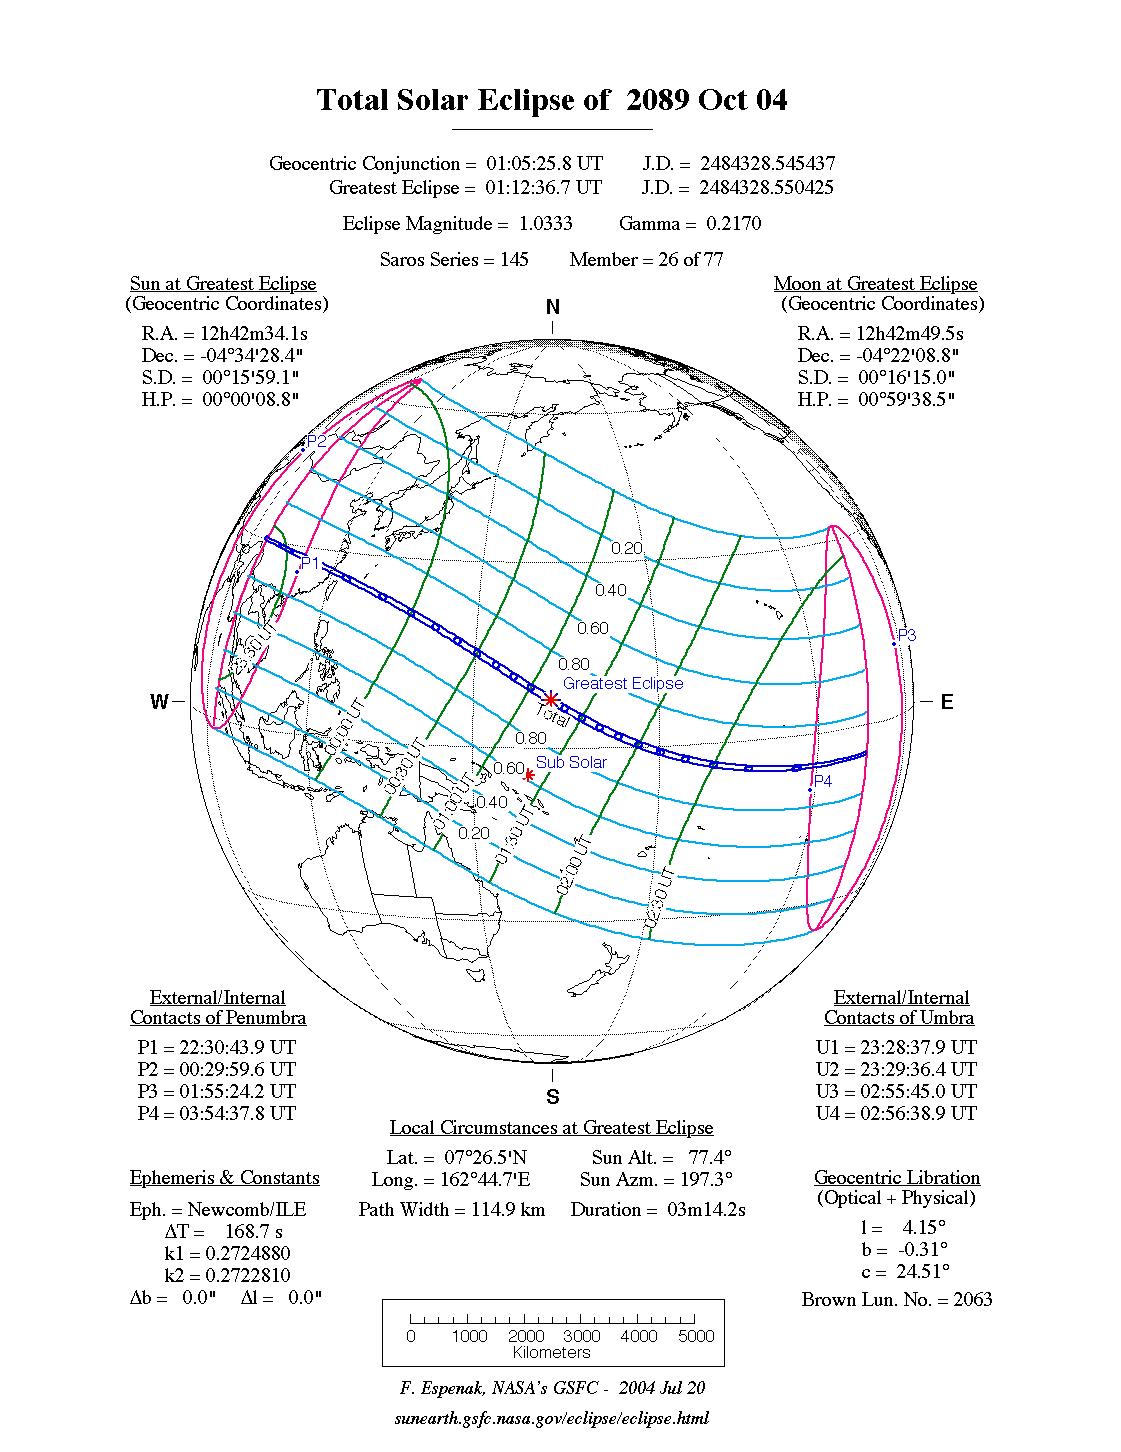
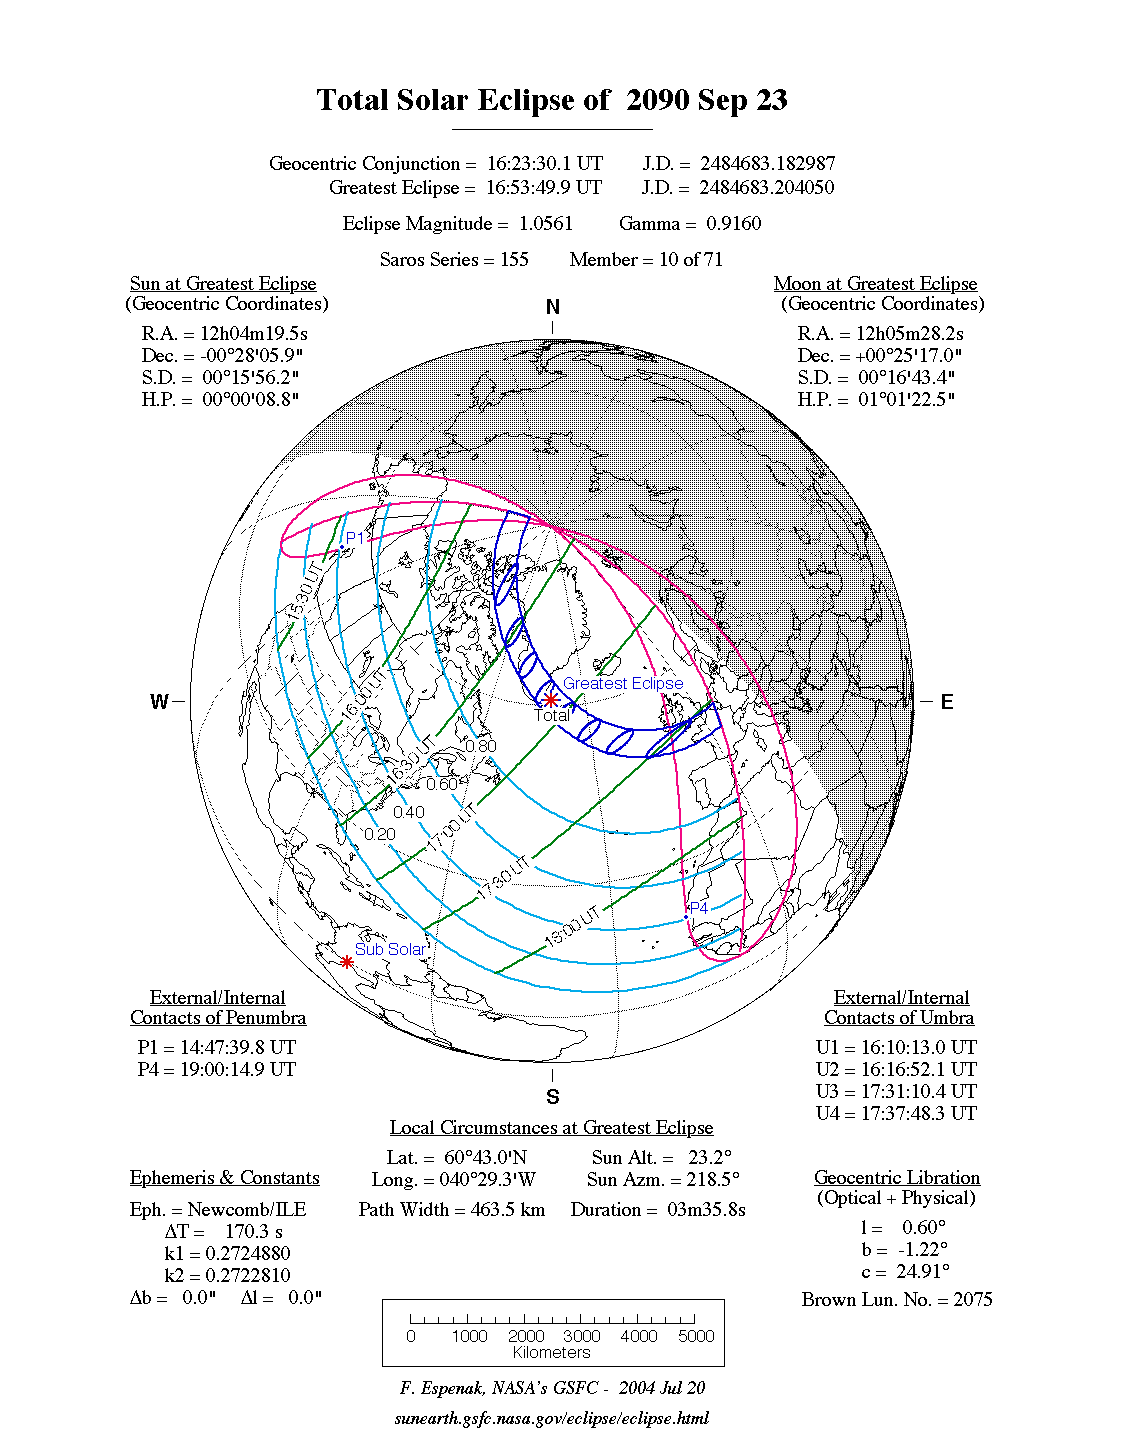
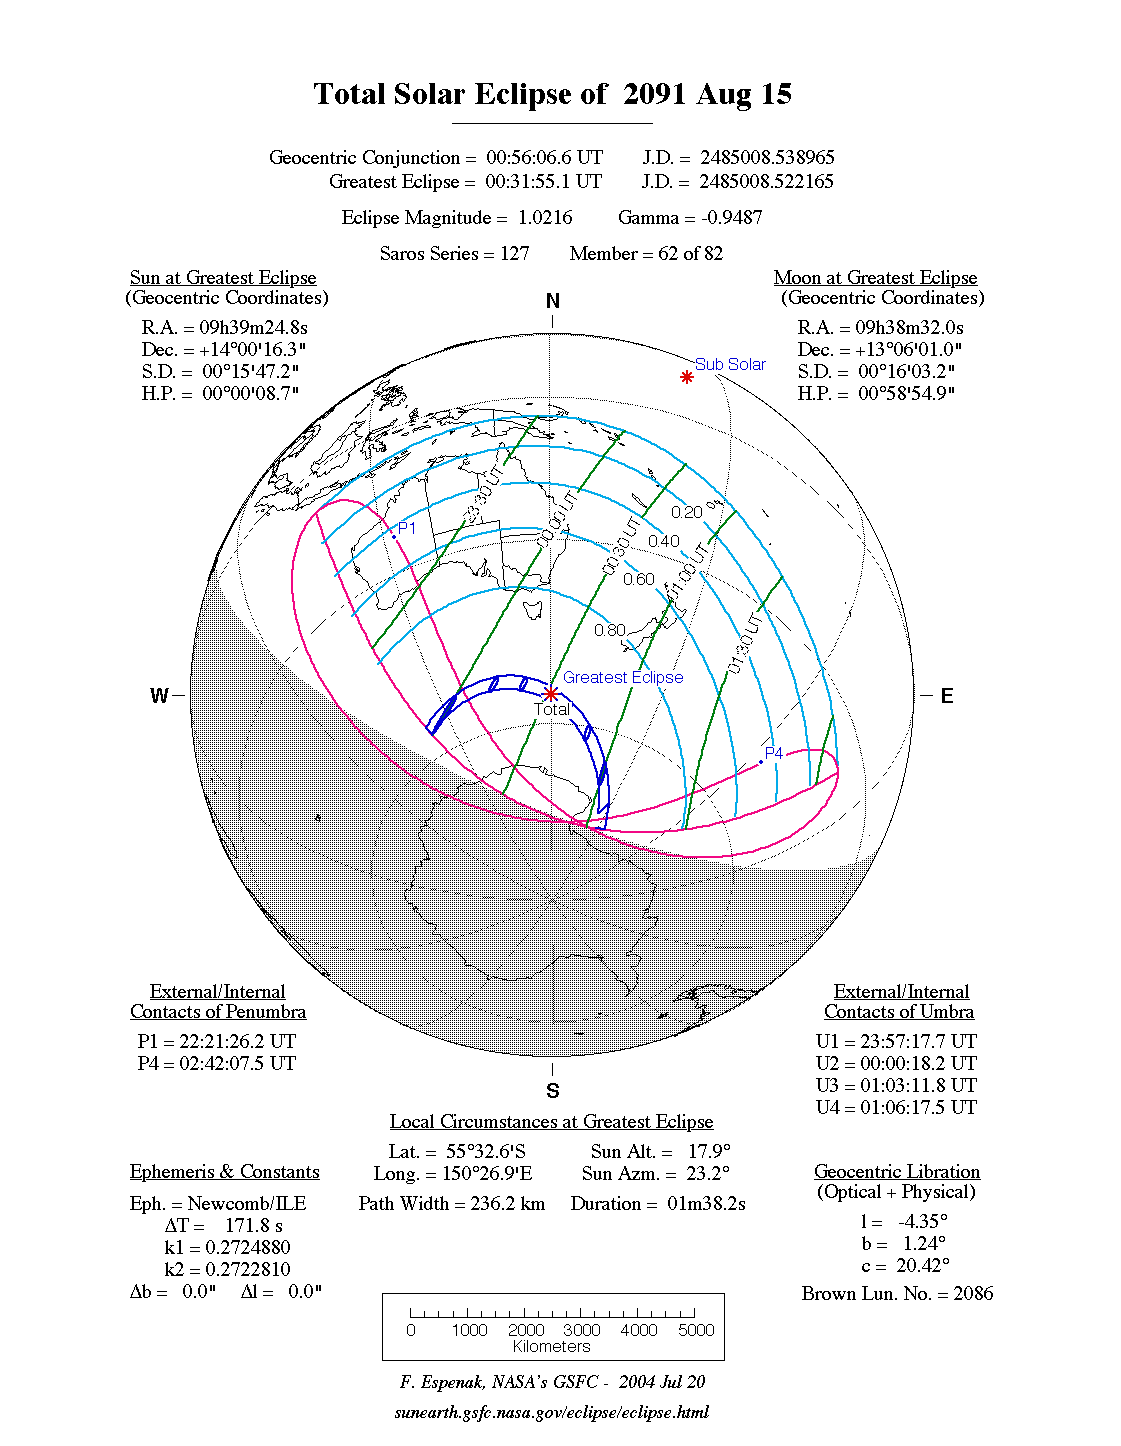
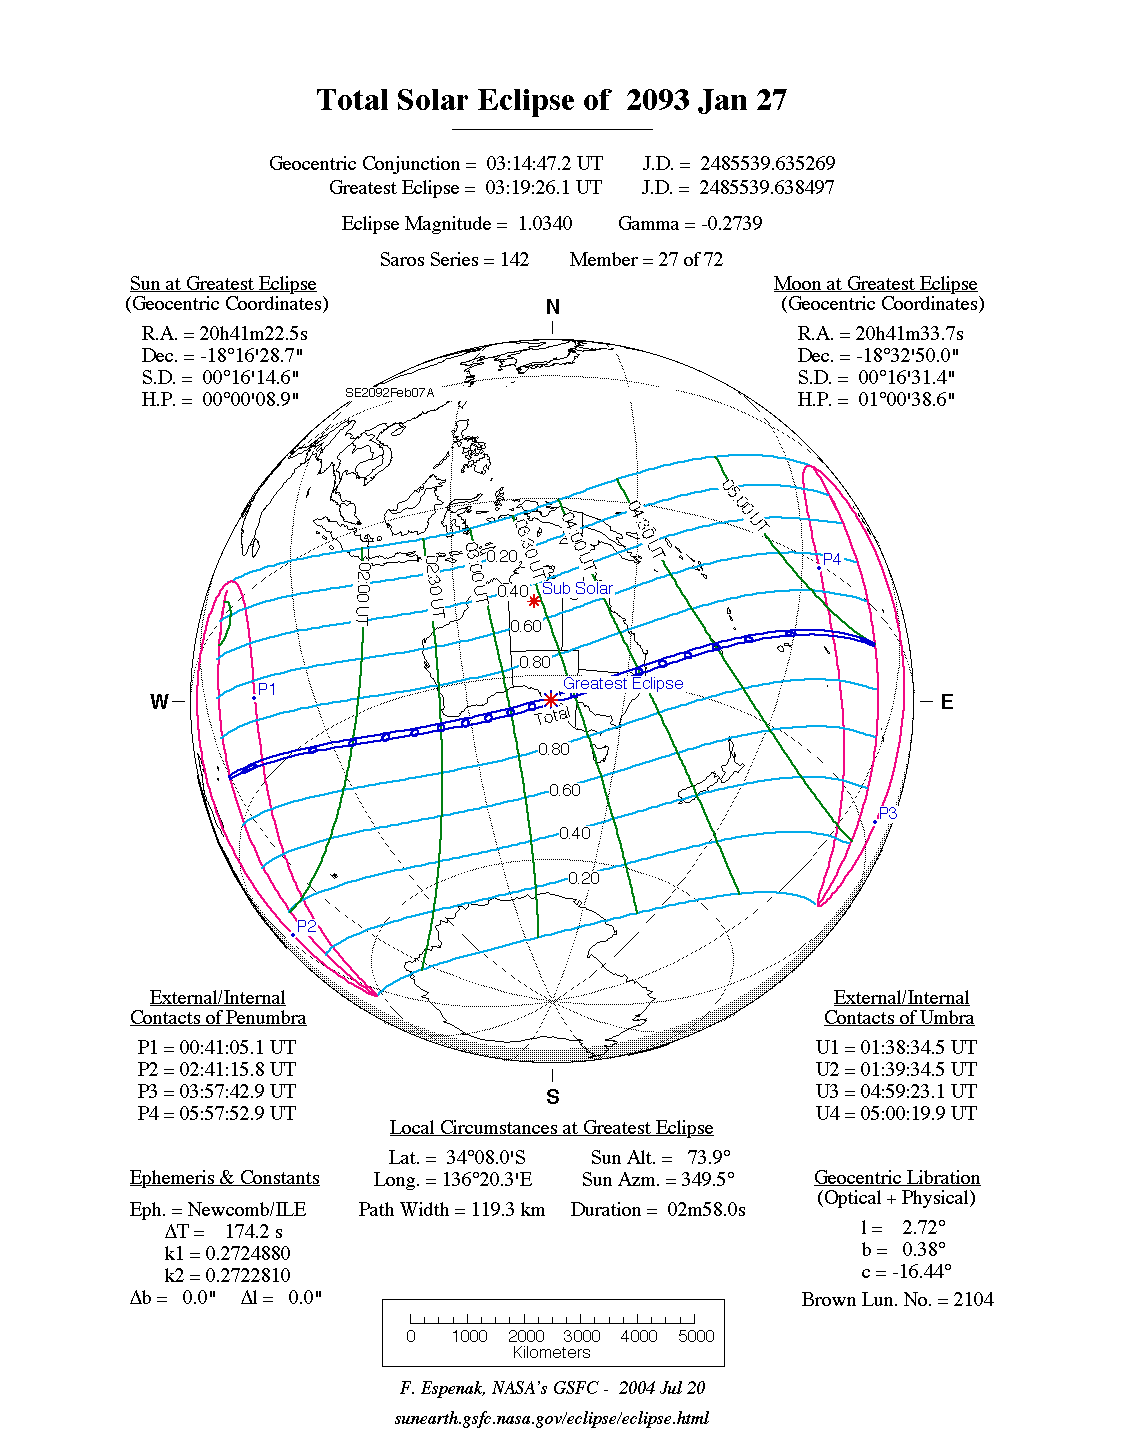
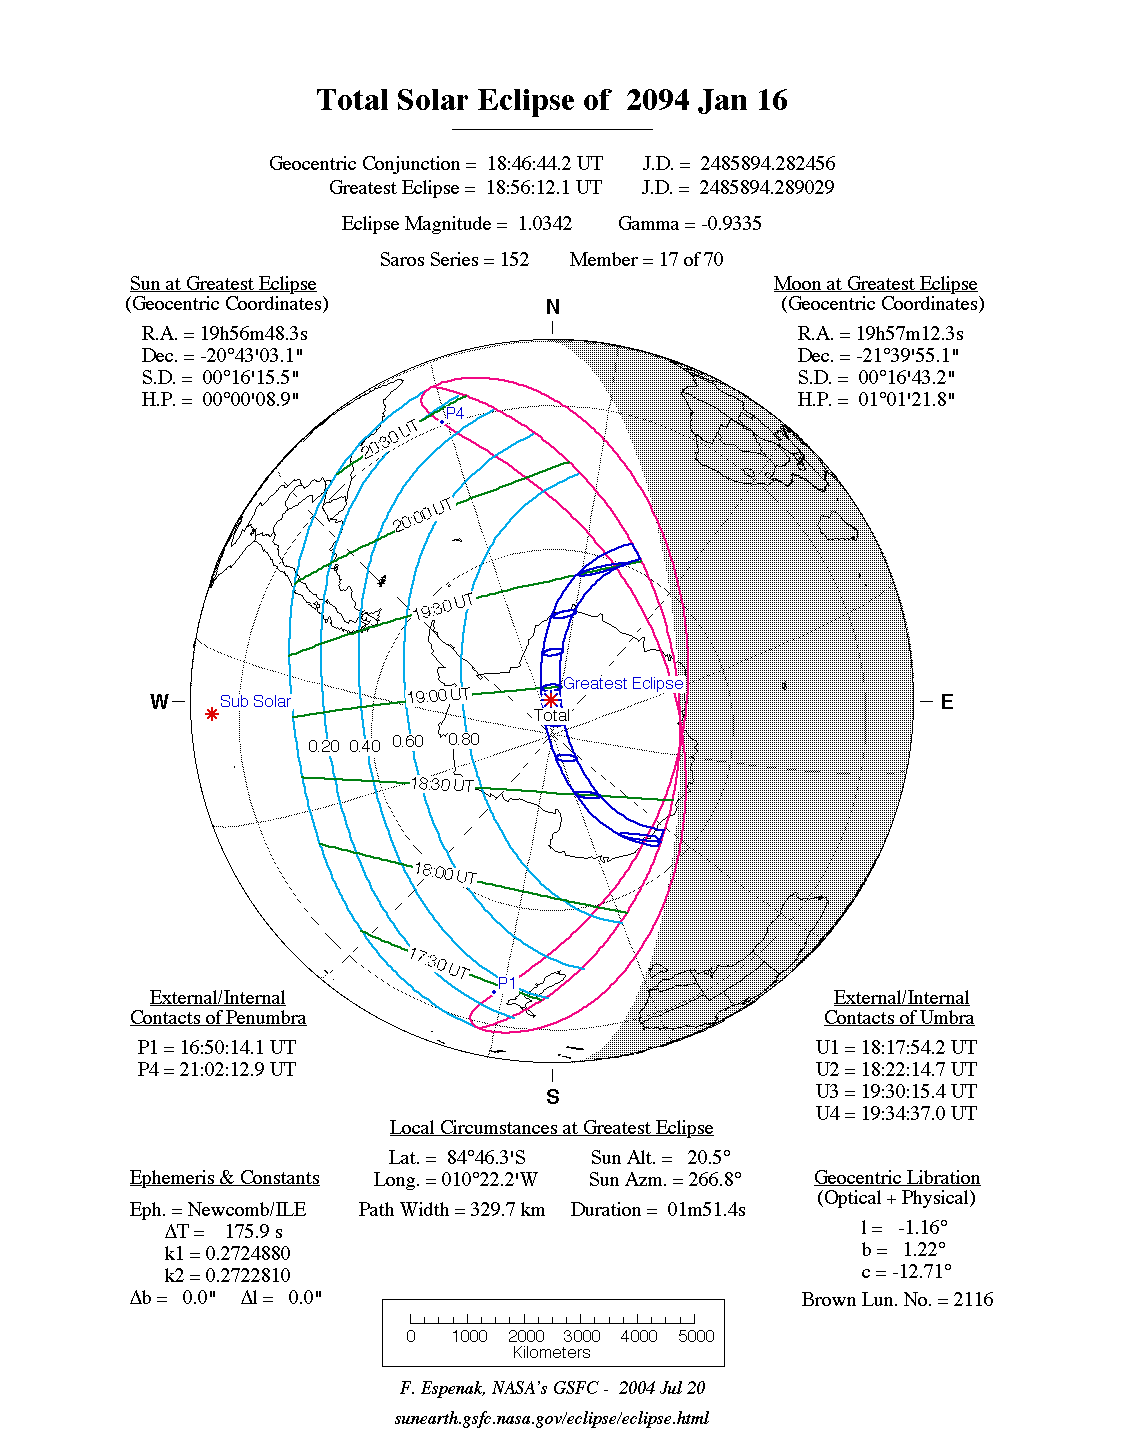
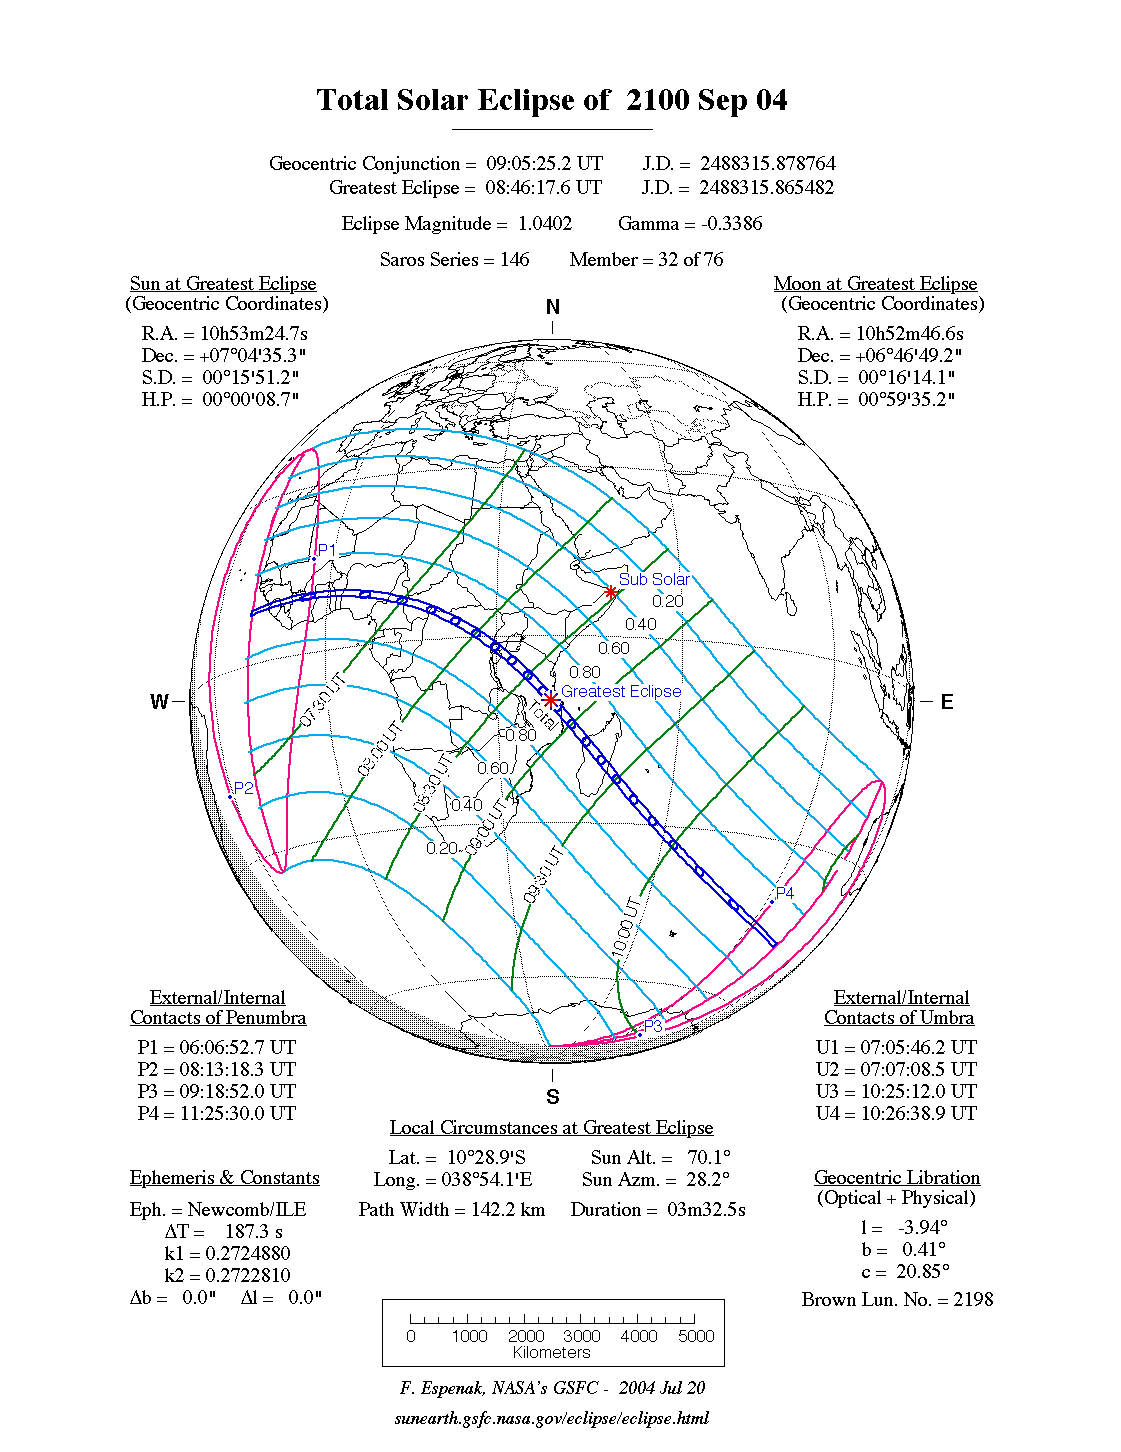
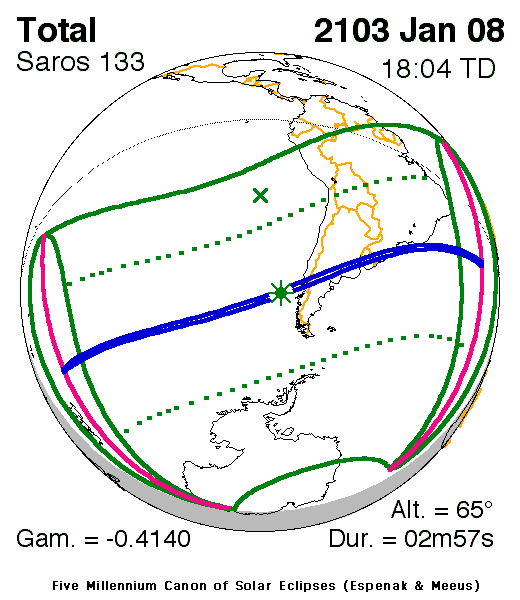
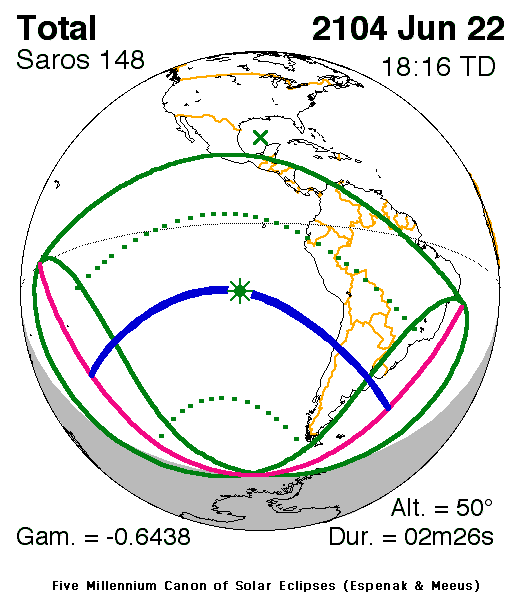
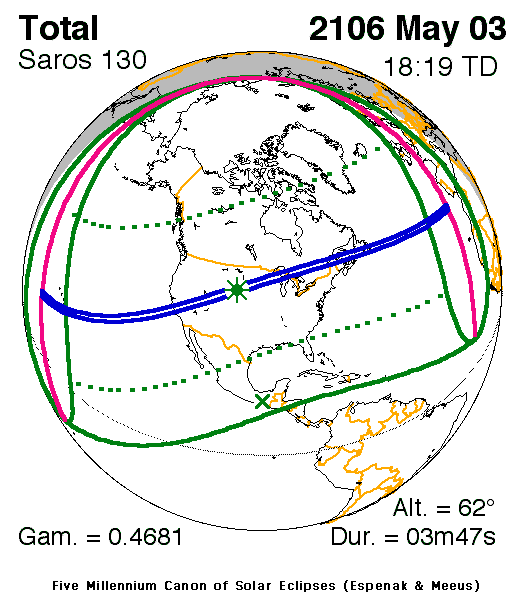
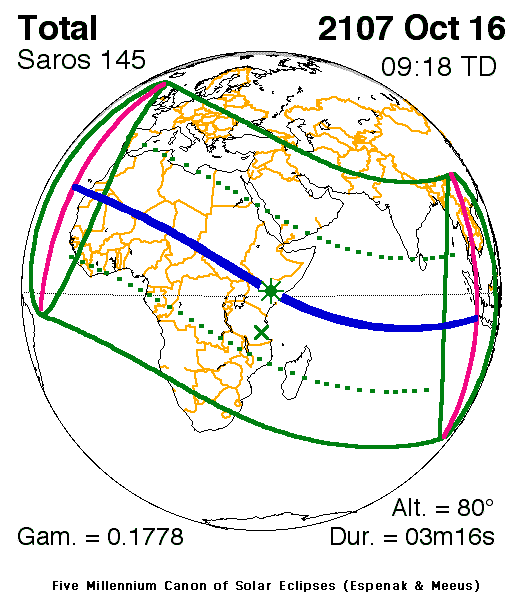
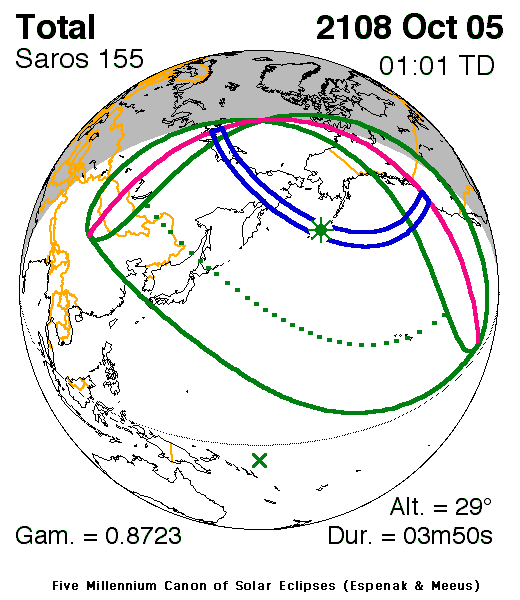
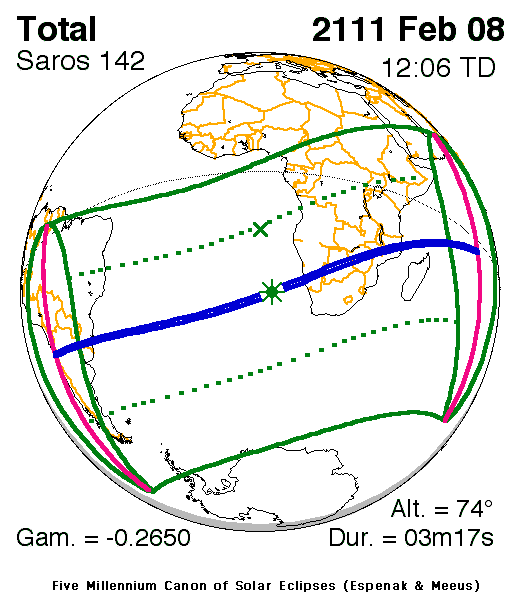
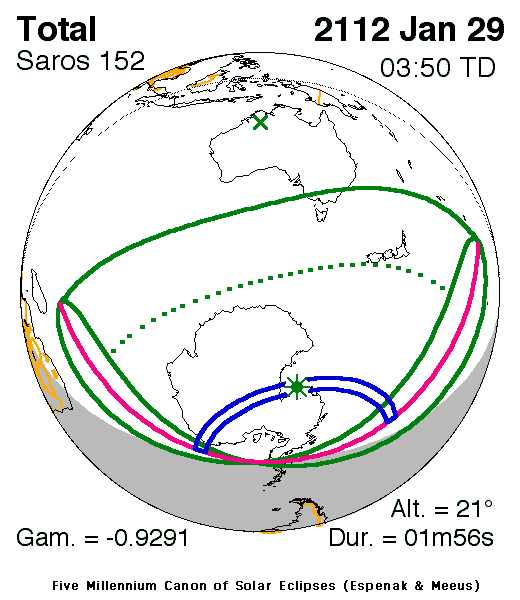
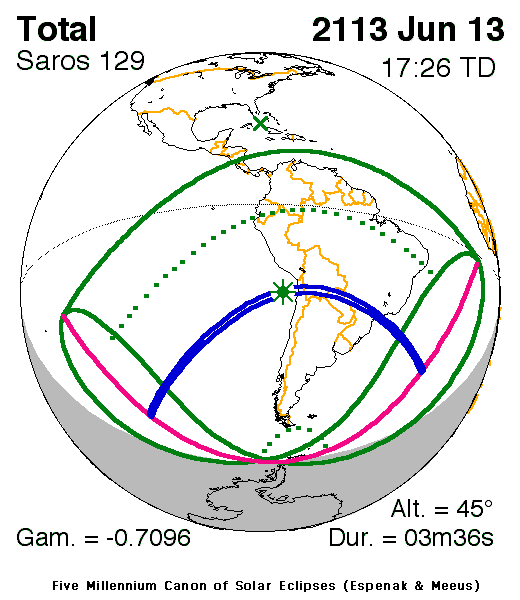
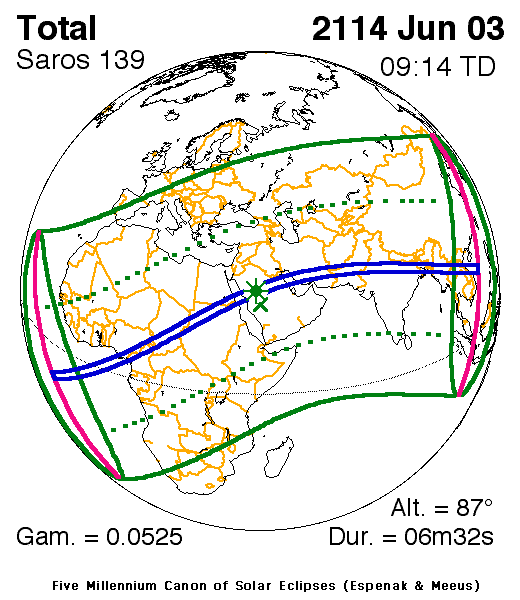
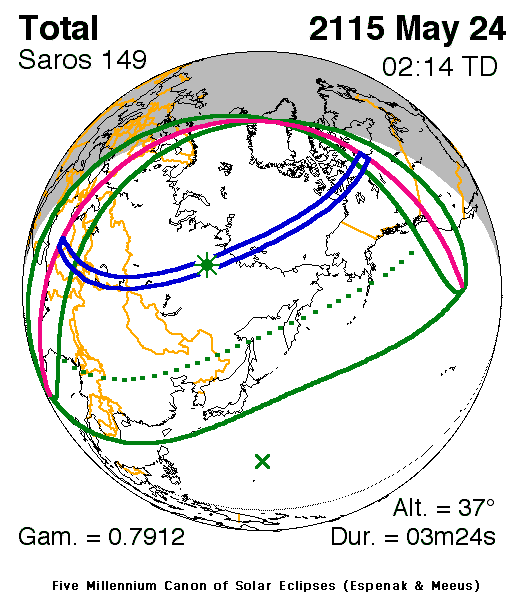
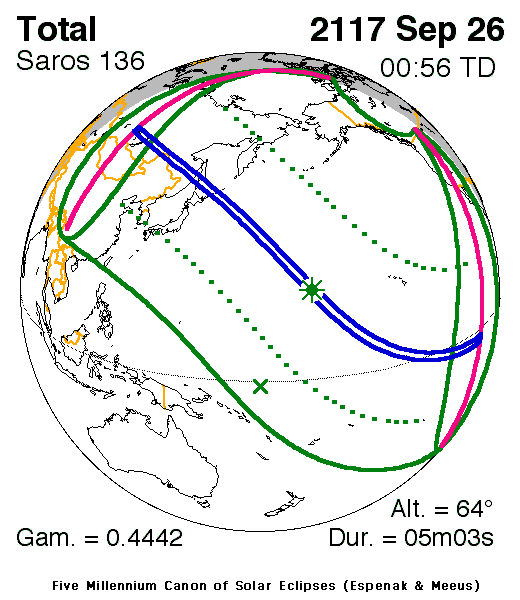
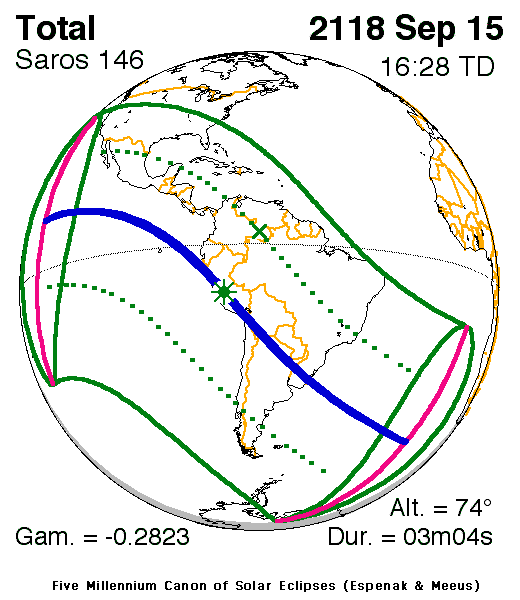
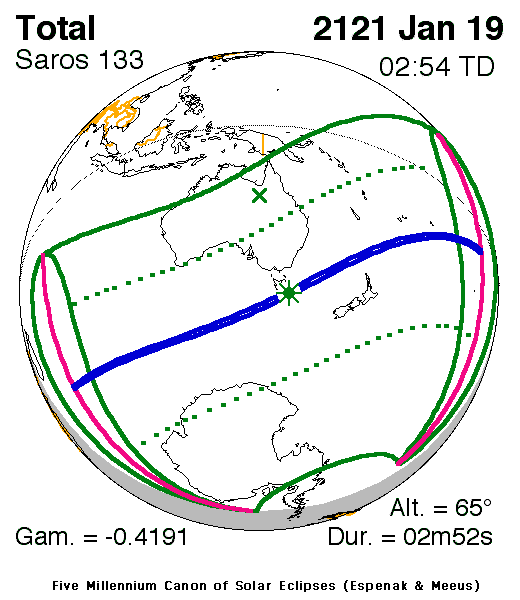
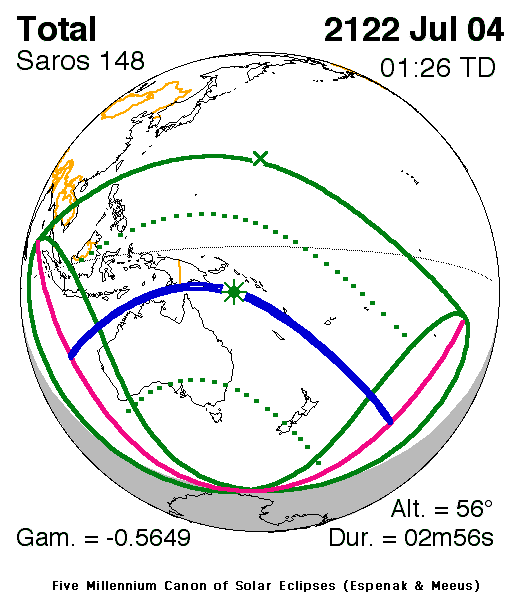
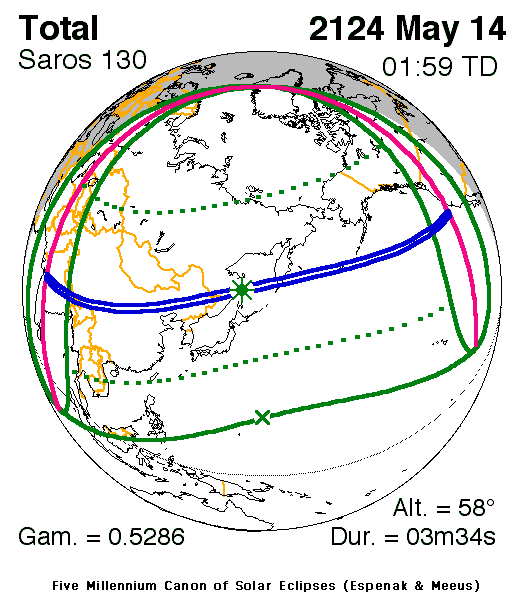
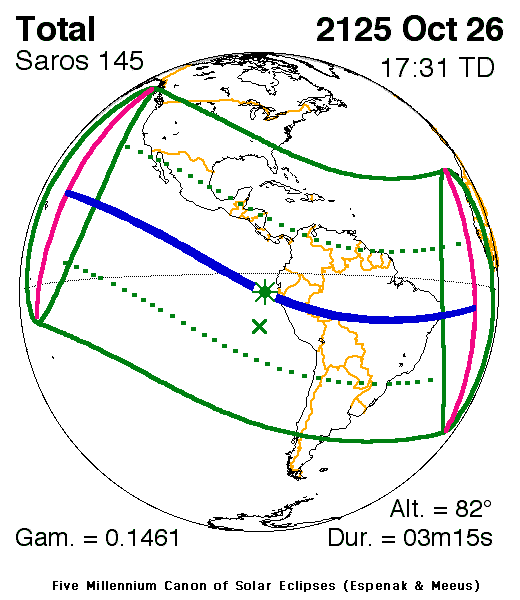
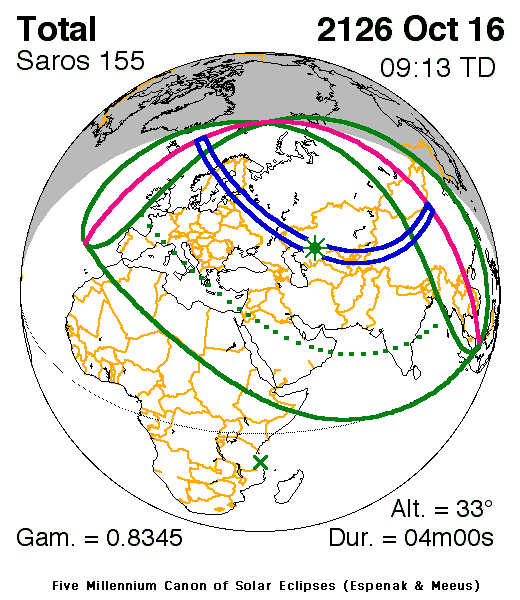
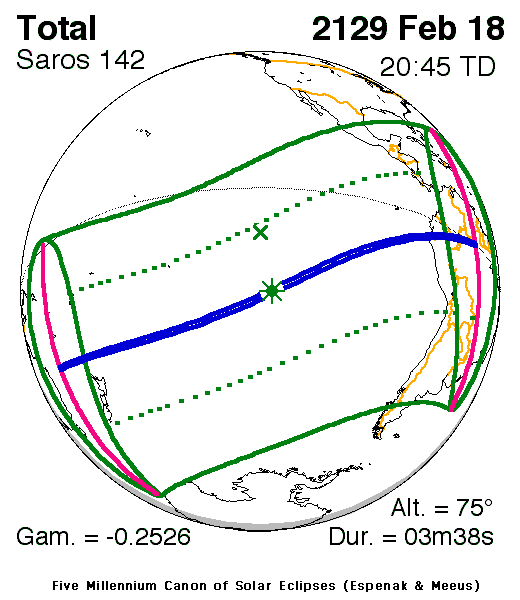
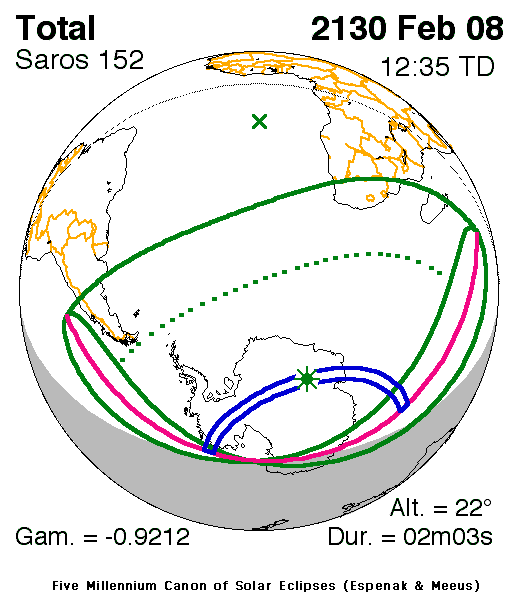
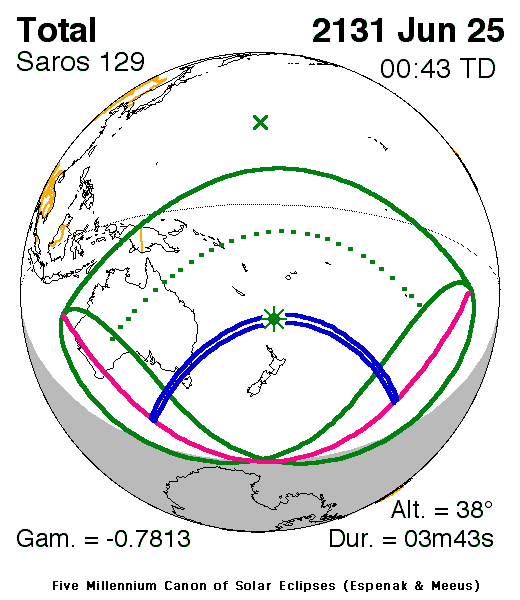
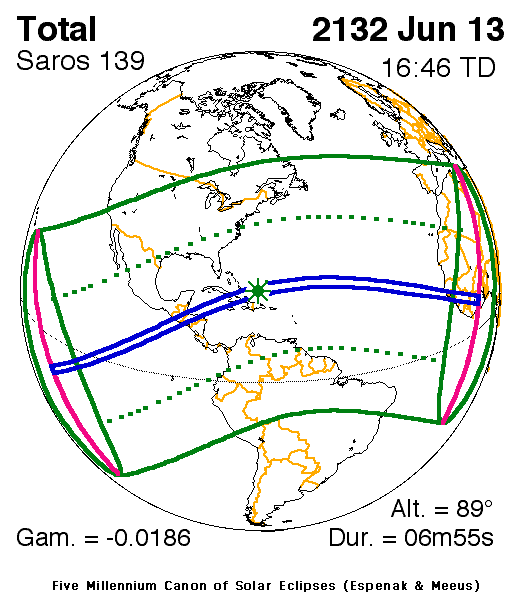
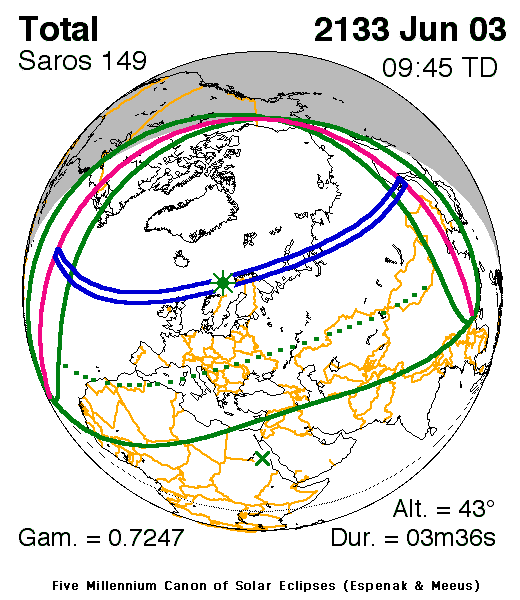
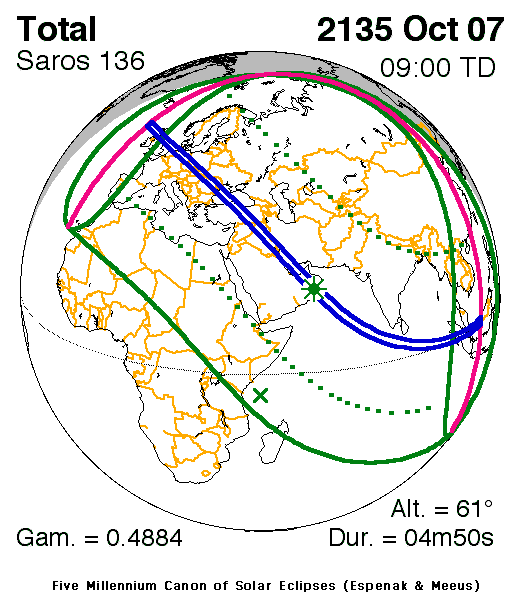
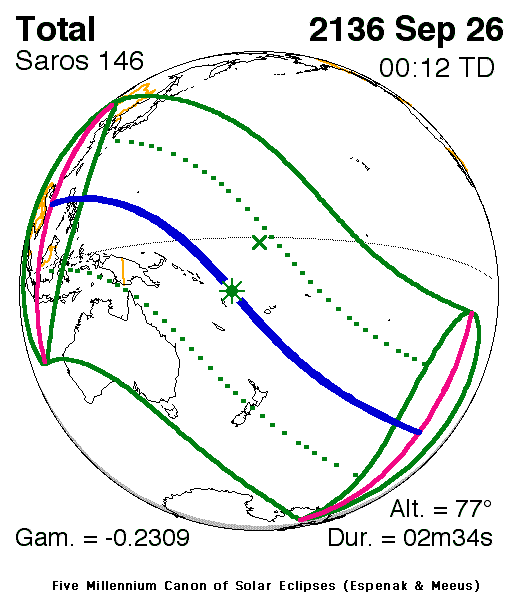
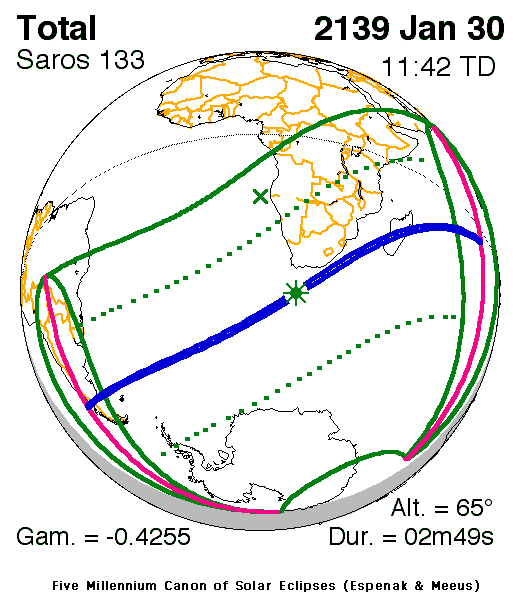
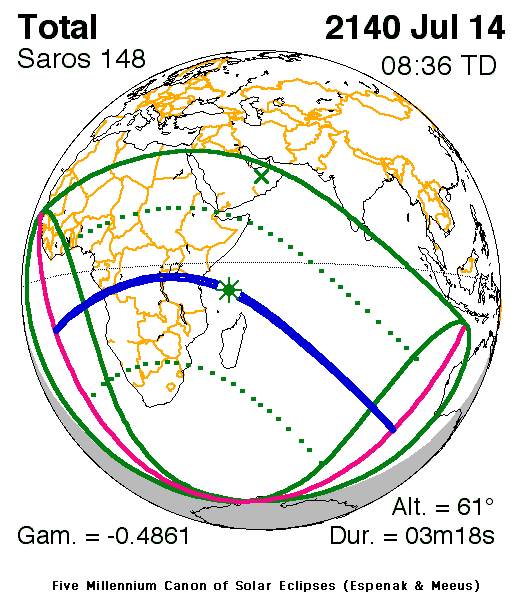
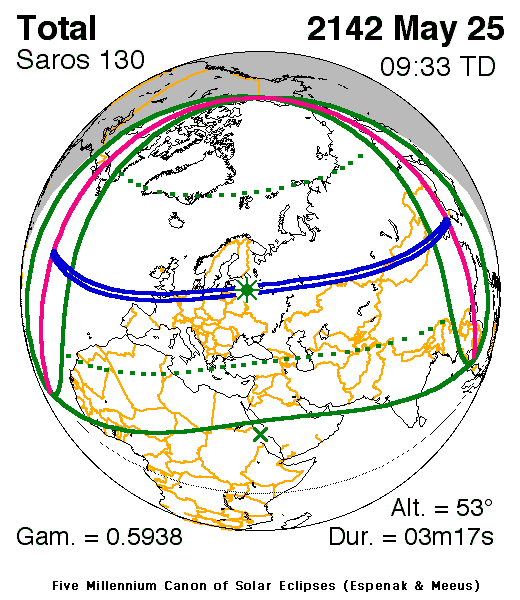
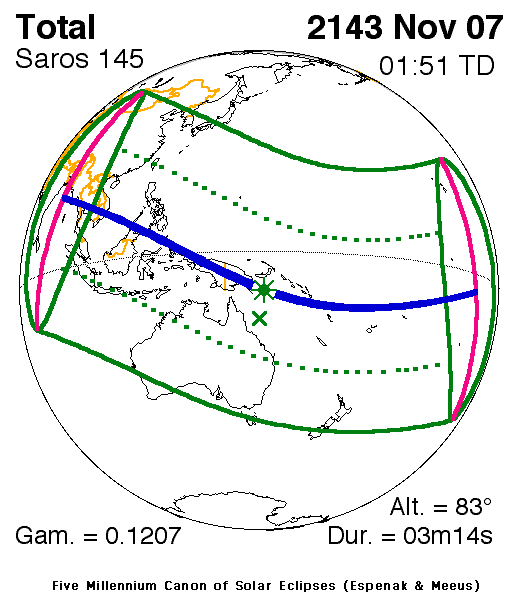
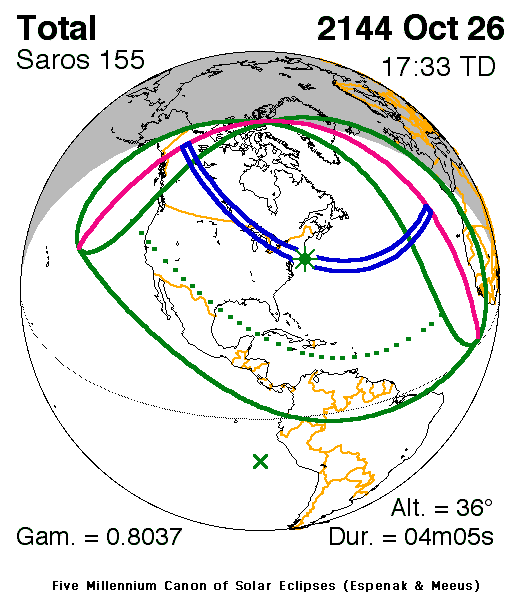
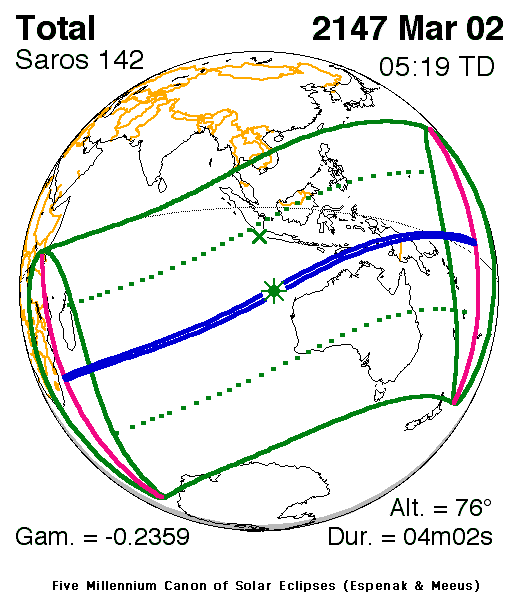
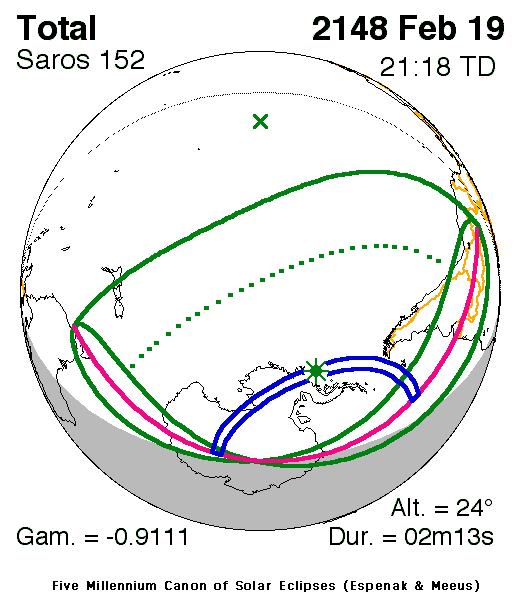
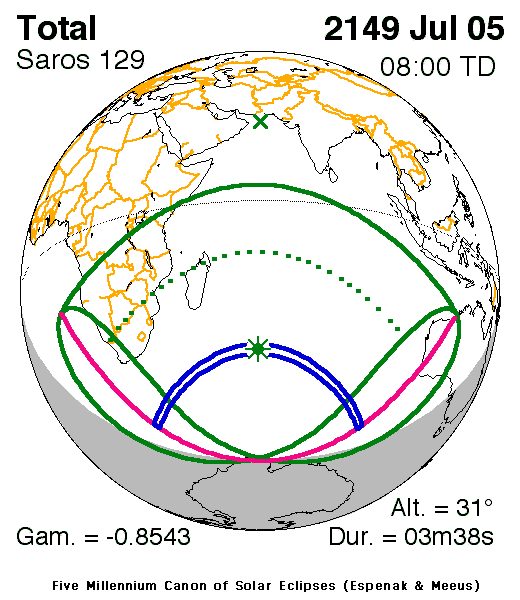
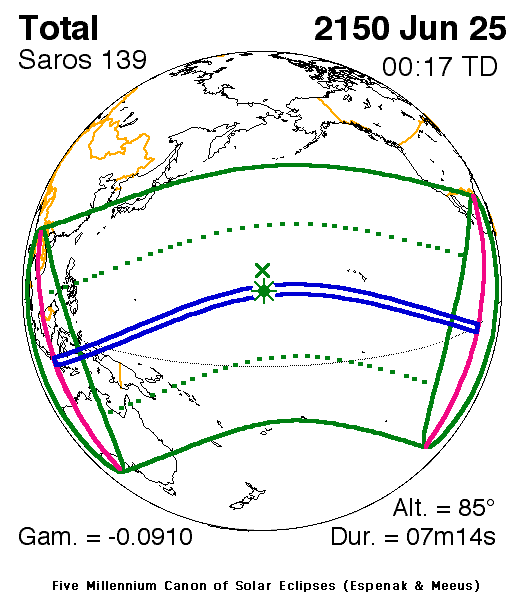
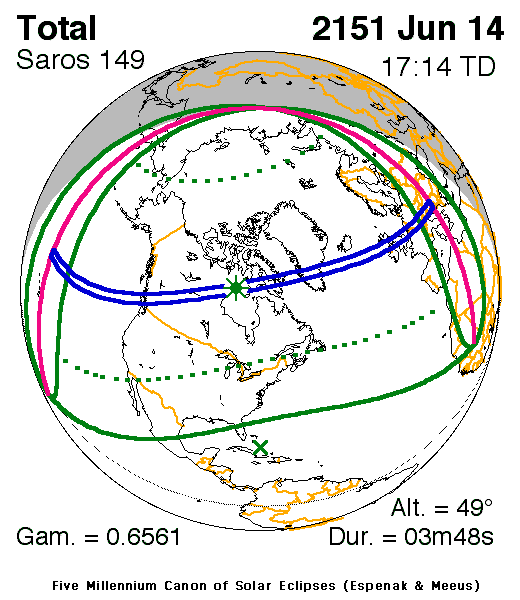
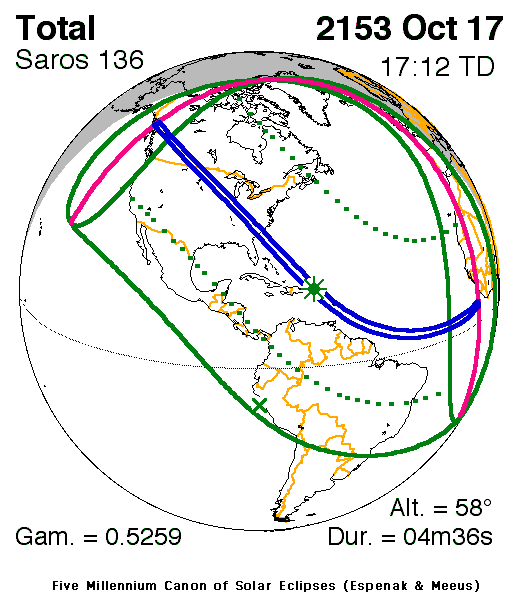
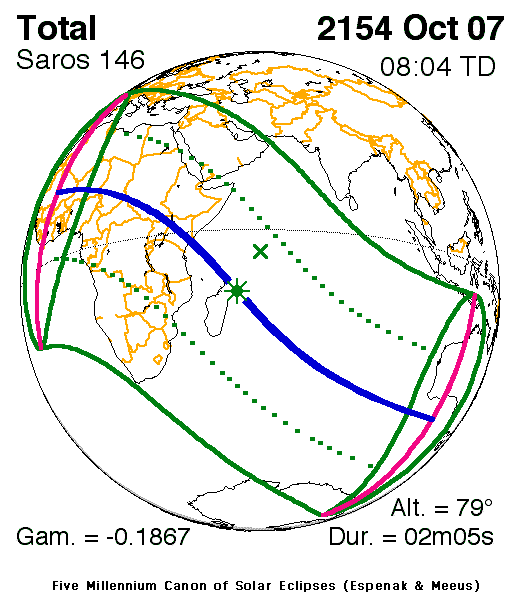
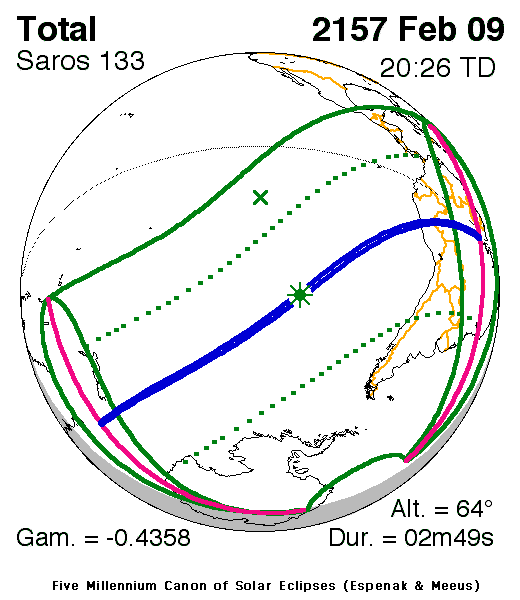
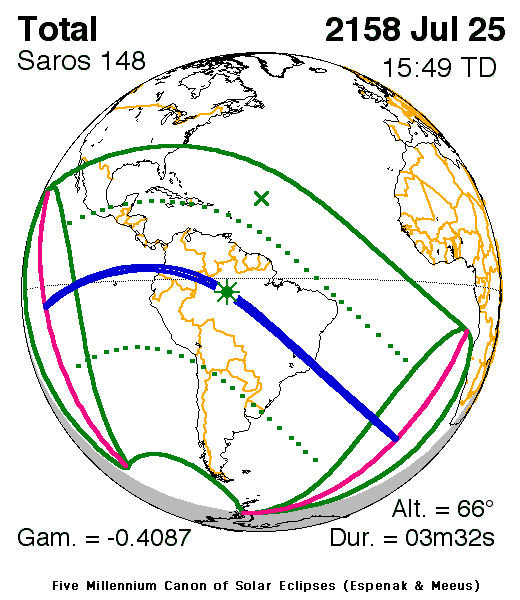
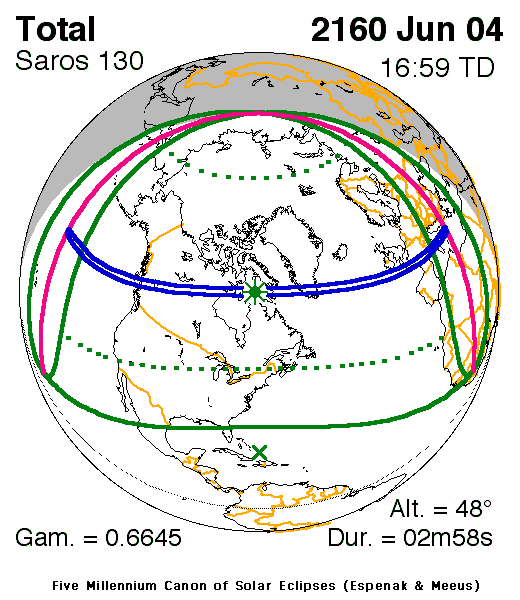
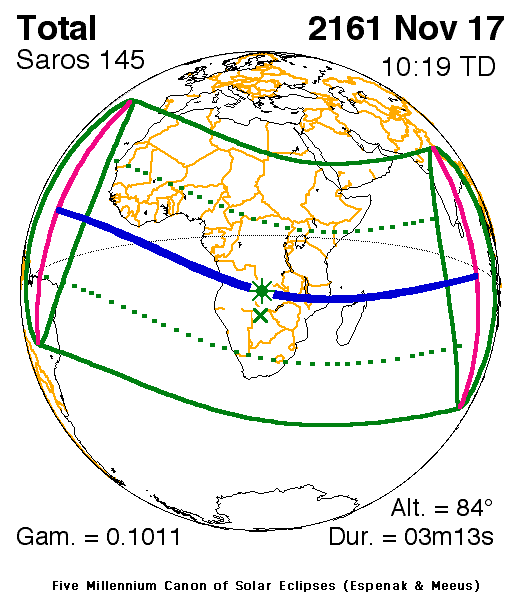
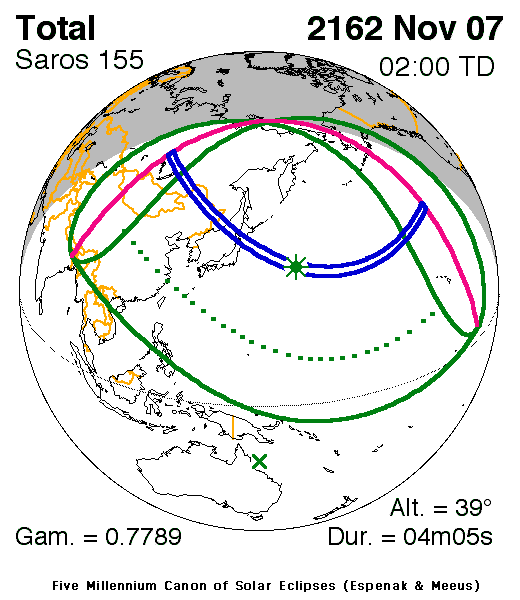
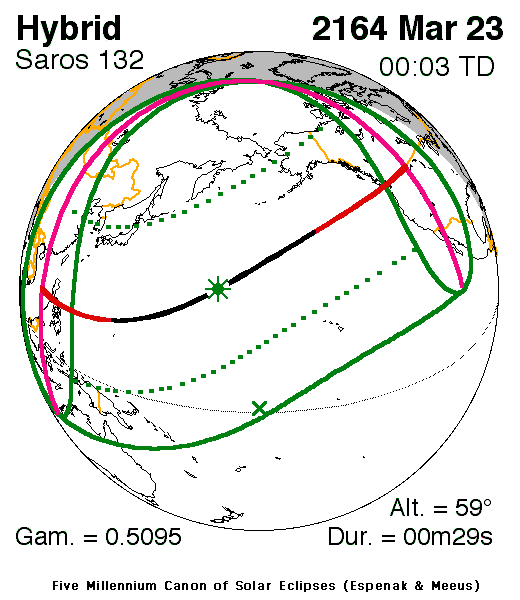
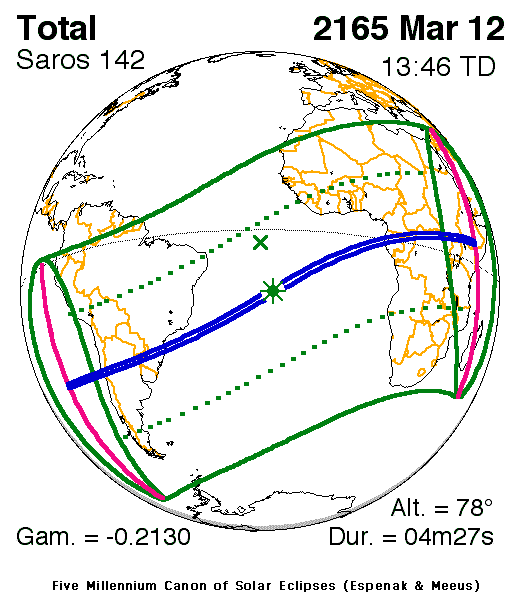
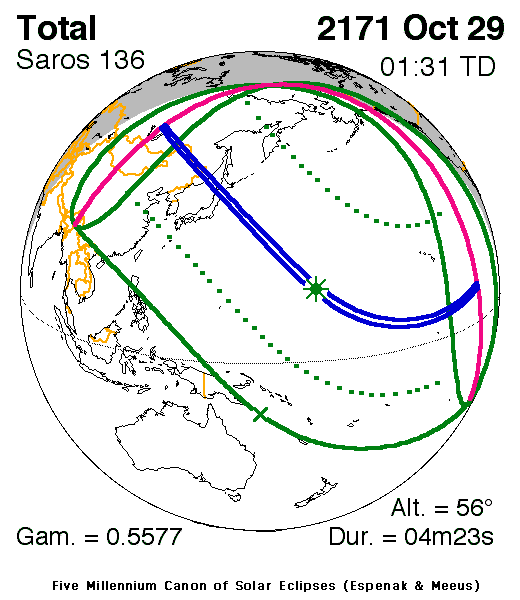
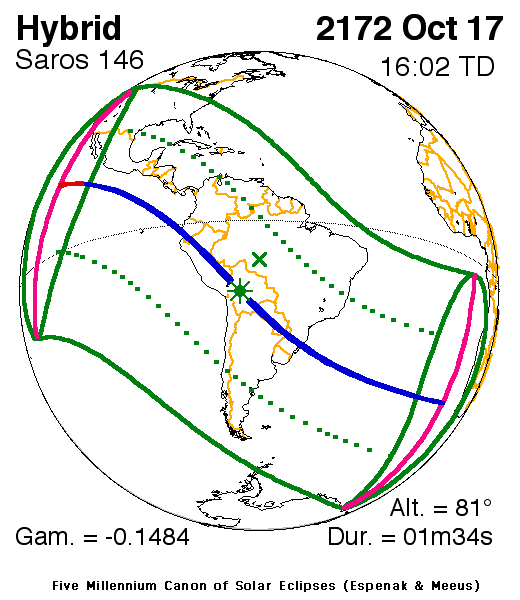
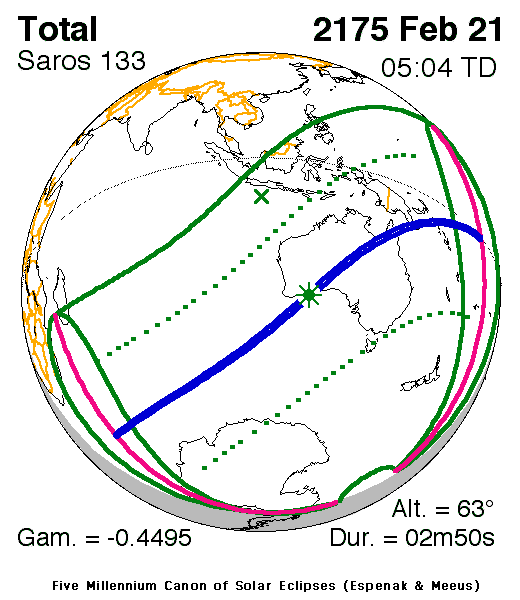
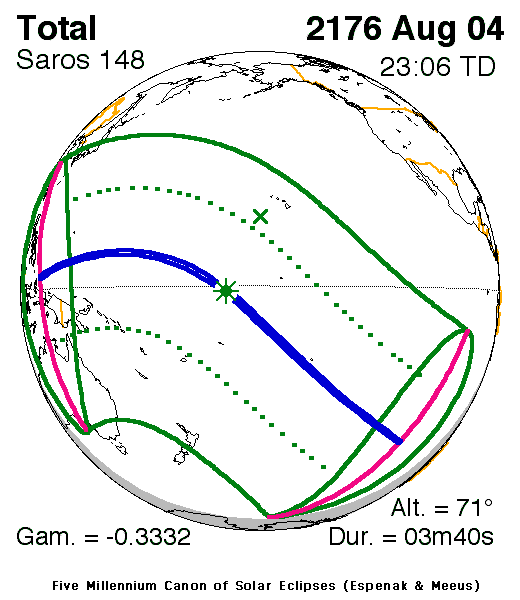
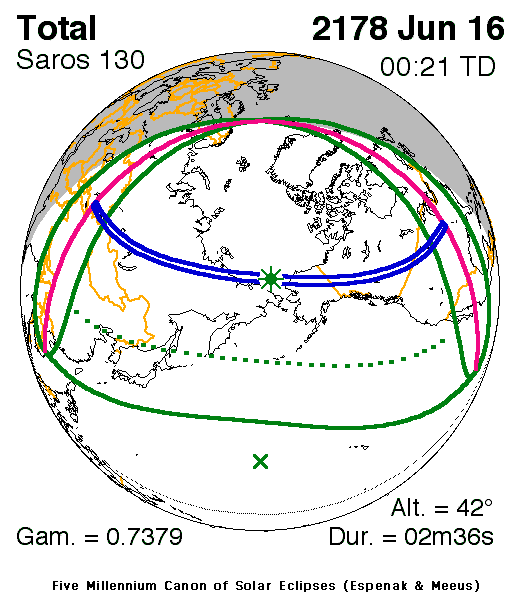
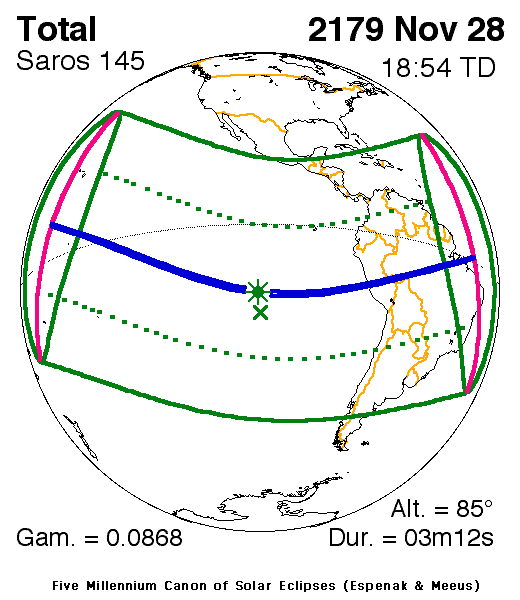
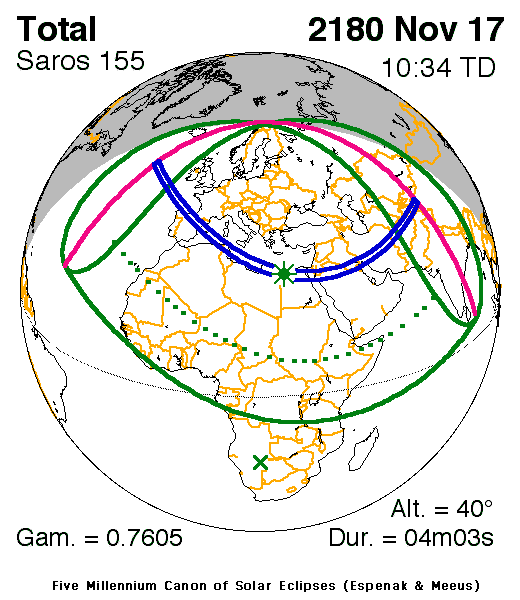
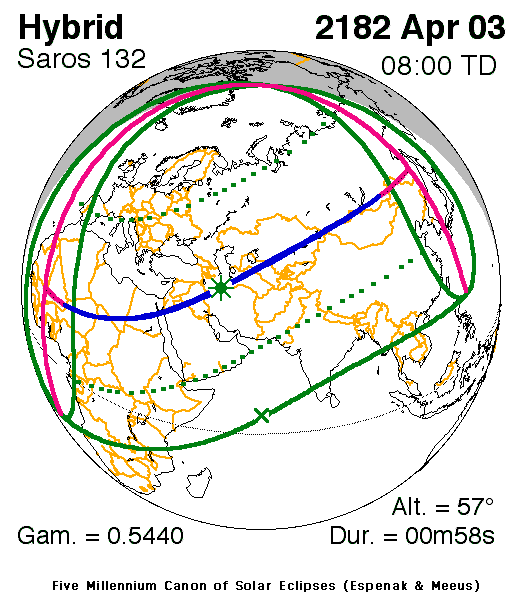
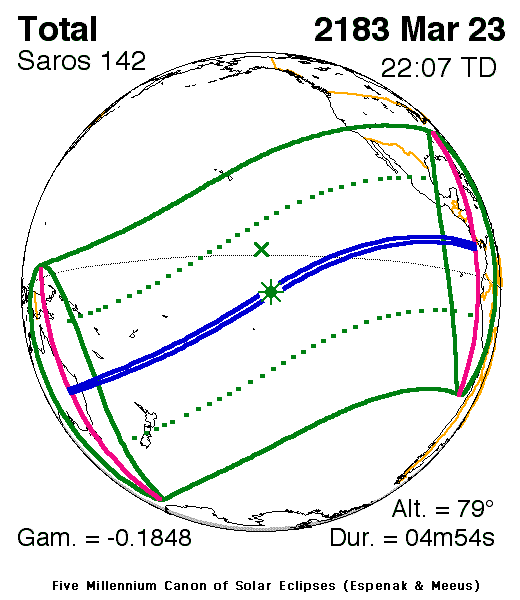
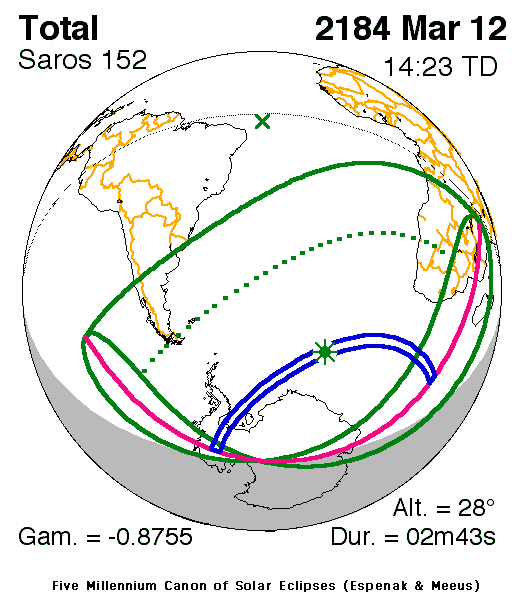
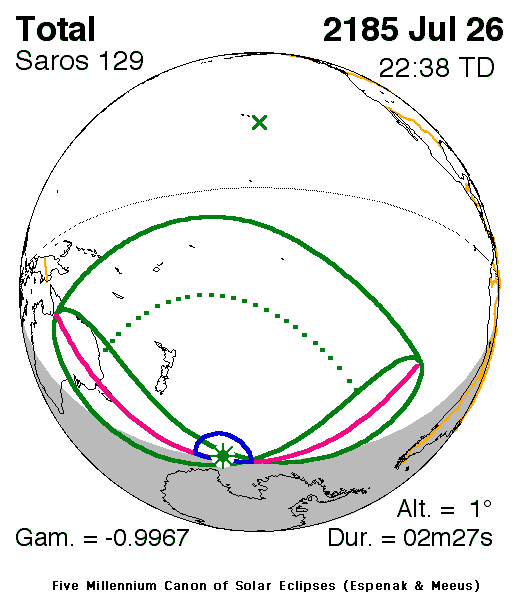
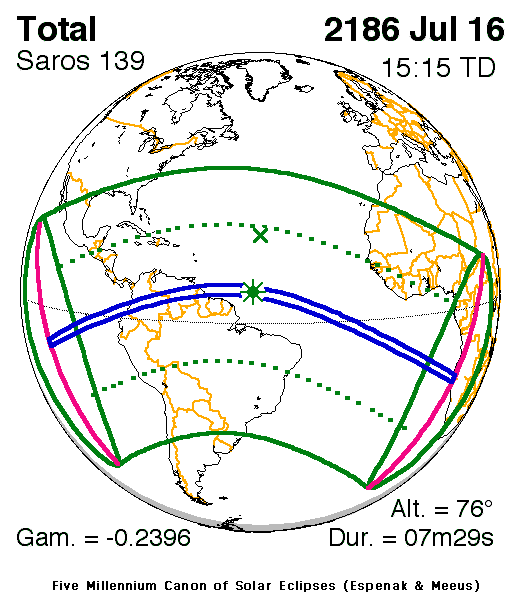
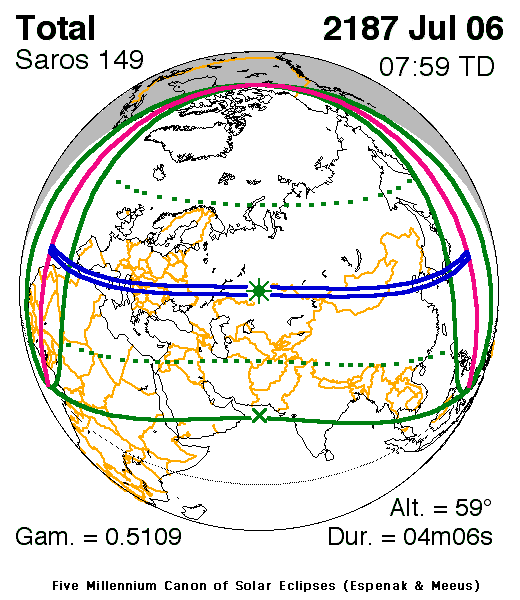
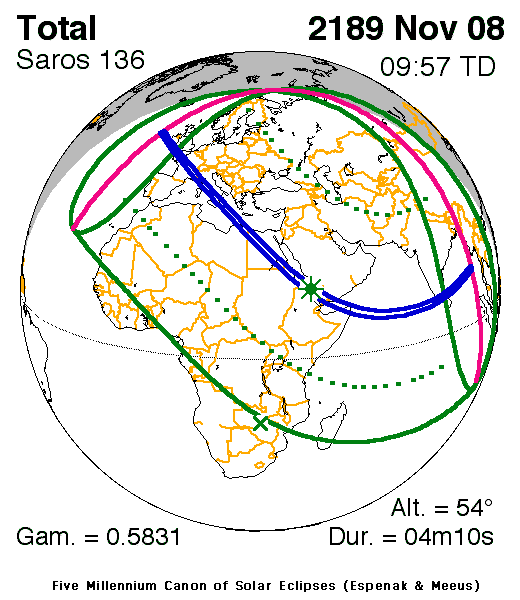
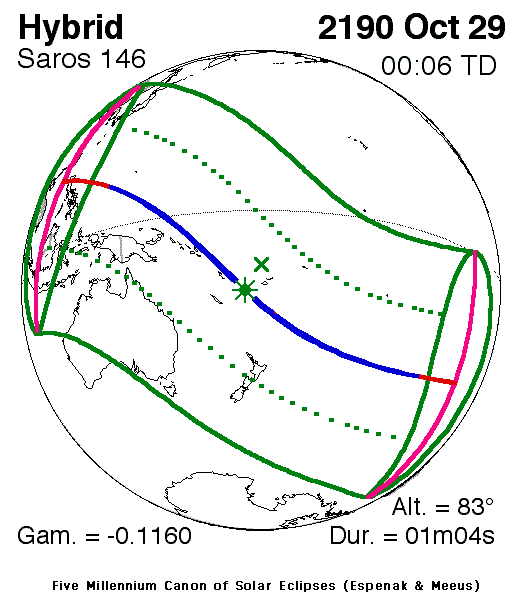
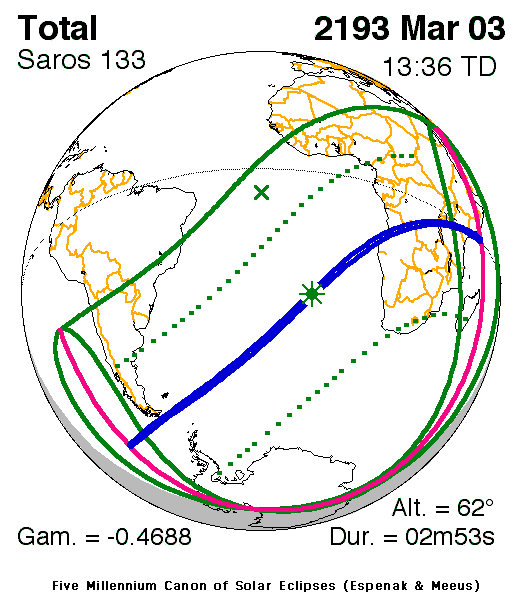
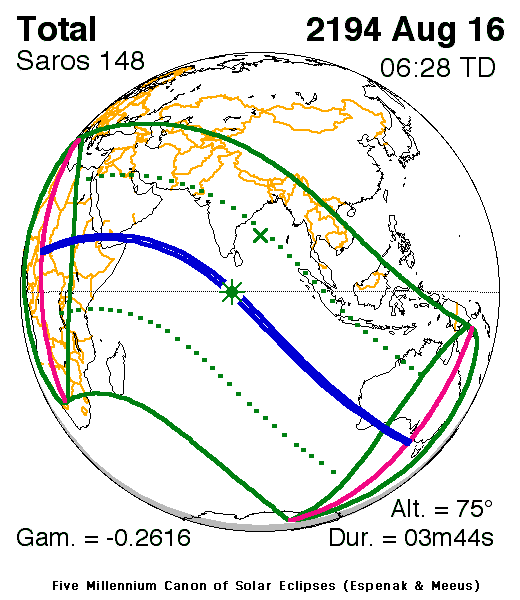
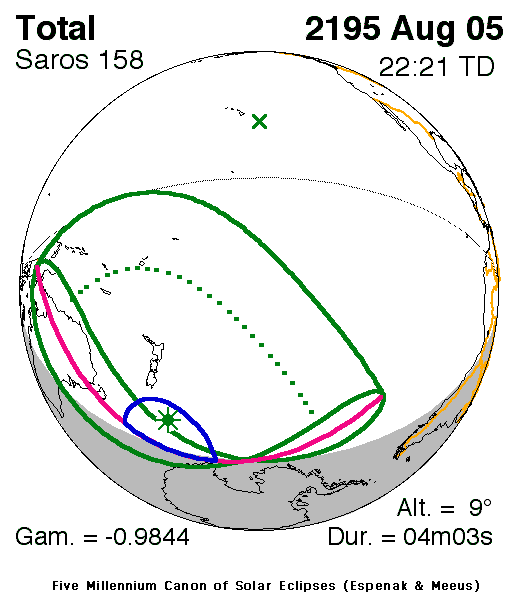
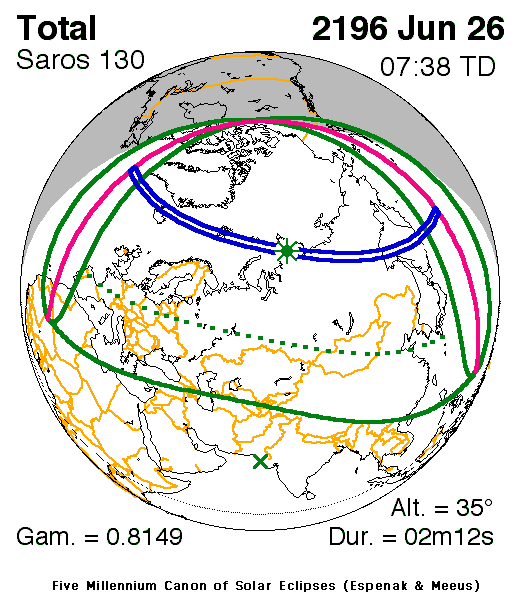
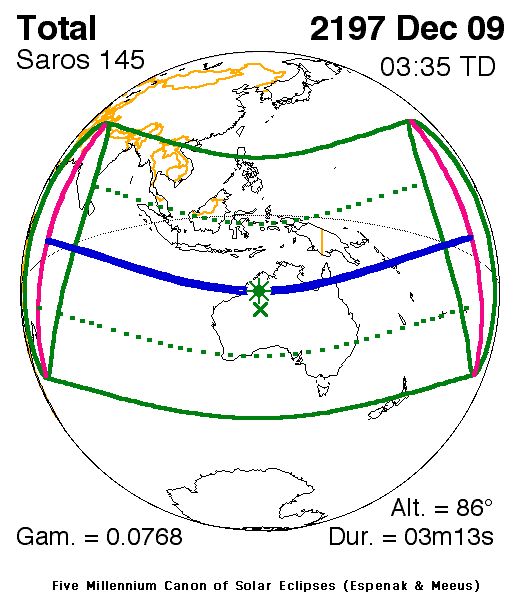
Through 2100, each map is NASA's detailed orthographic map of the eclipse2: the dark blue band is the path of totality, the light blue curves show how much of the Sun is covered in the partial eclipse on either side, the green lines mark the time (UT), and the red star is greatest eclipse. NASA doesn't publish those after 2100, so from 2101 the maps come from Espenak and Meeus's Five Millennium Canon5: the blue band is the path of totality and the green star marks greatest eclipse. Click a map to see it full size.
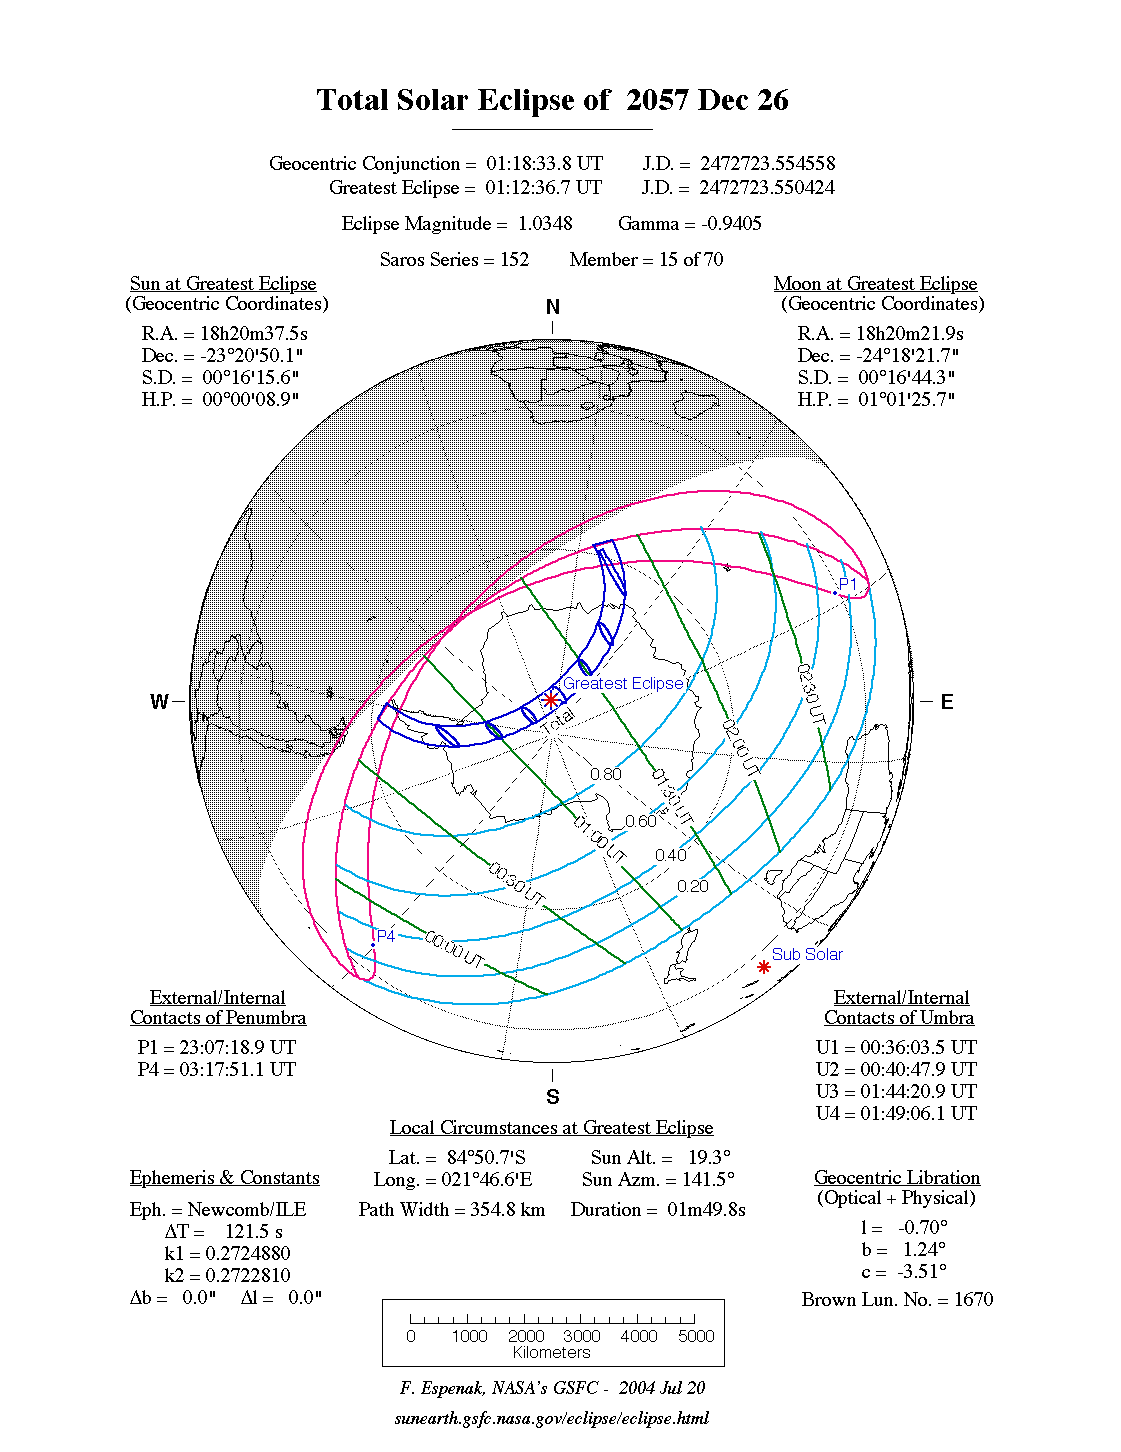
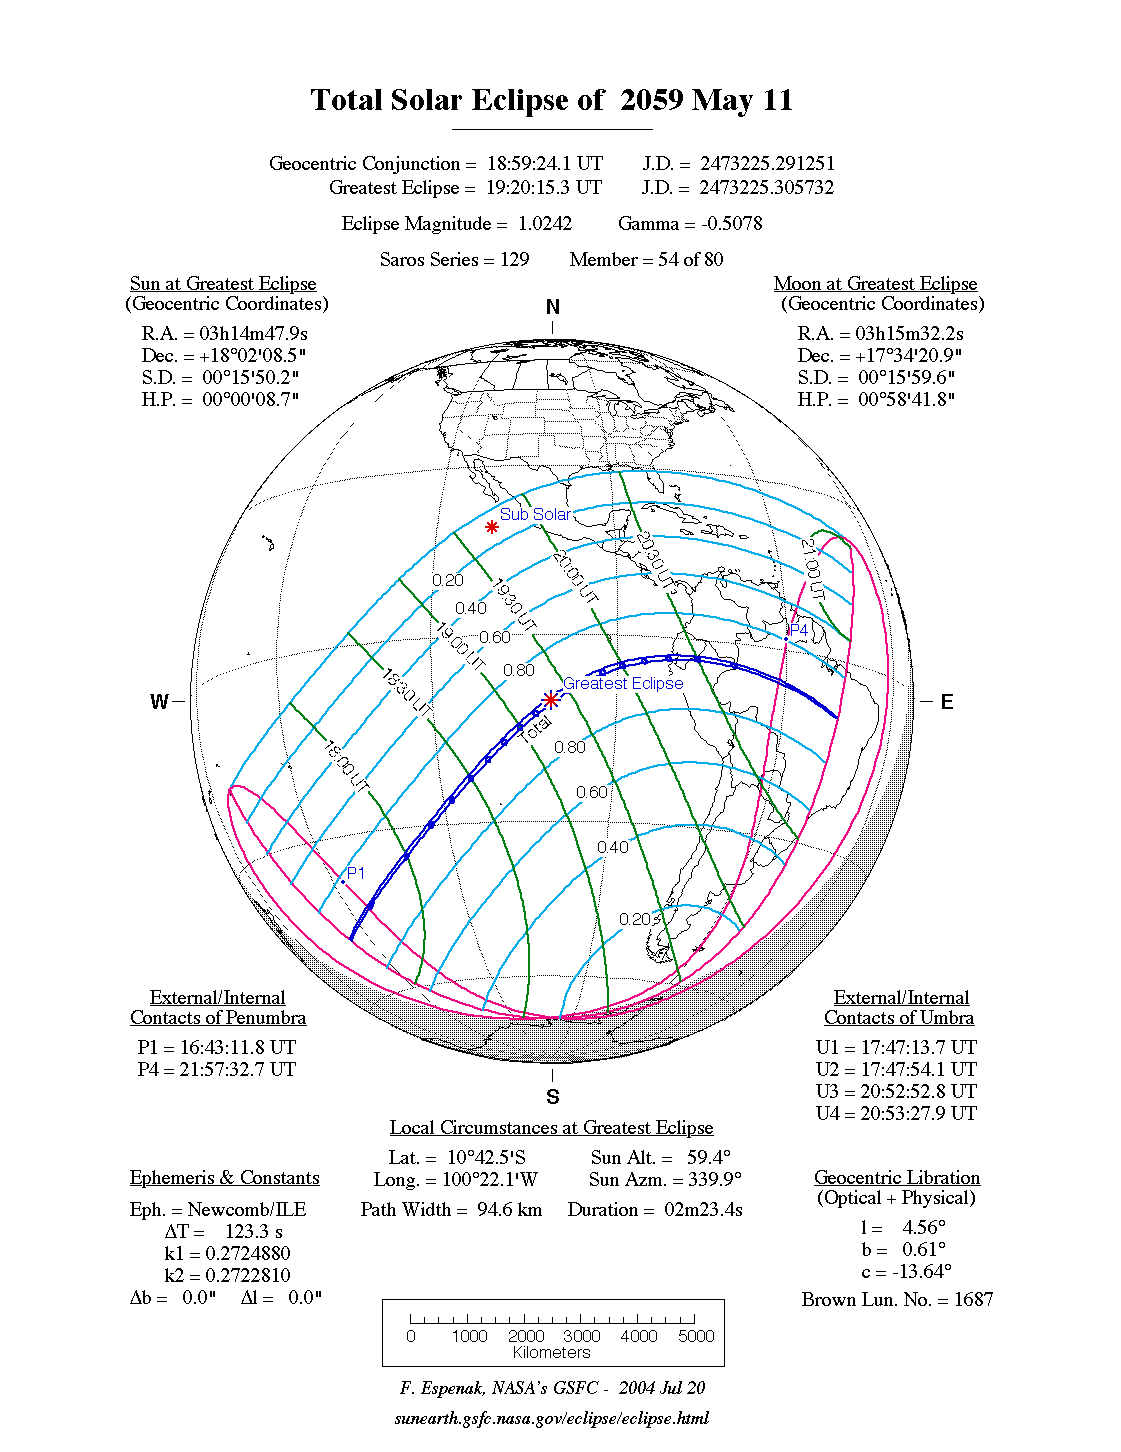
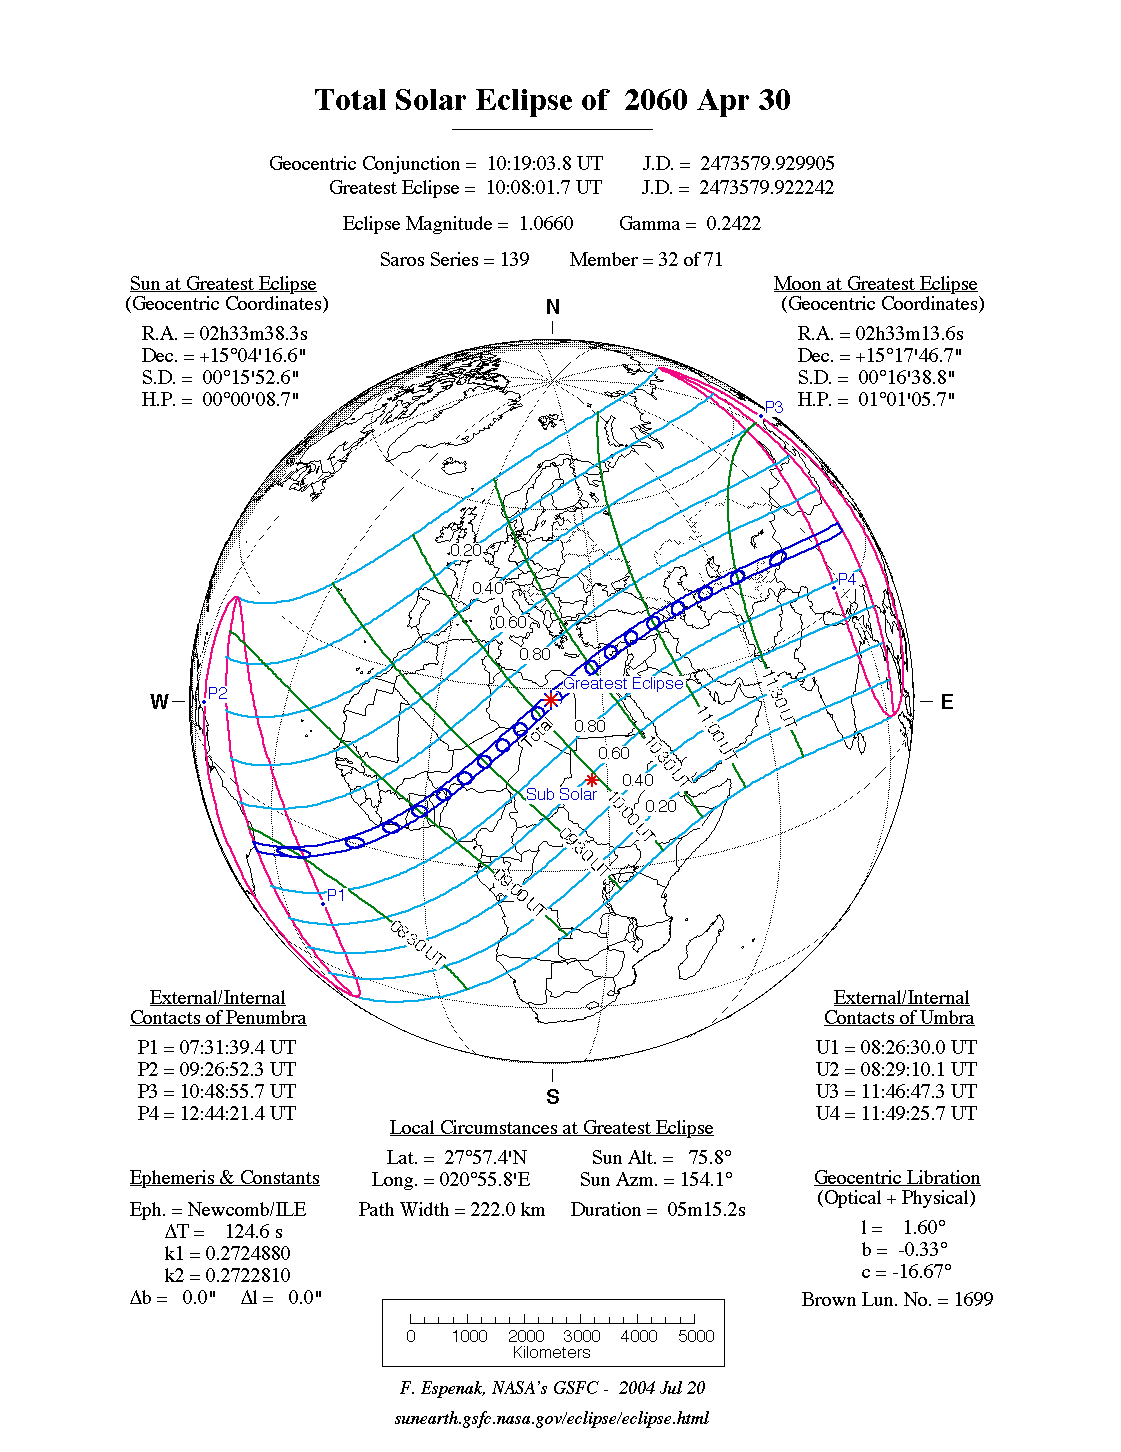
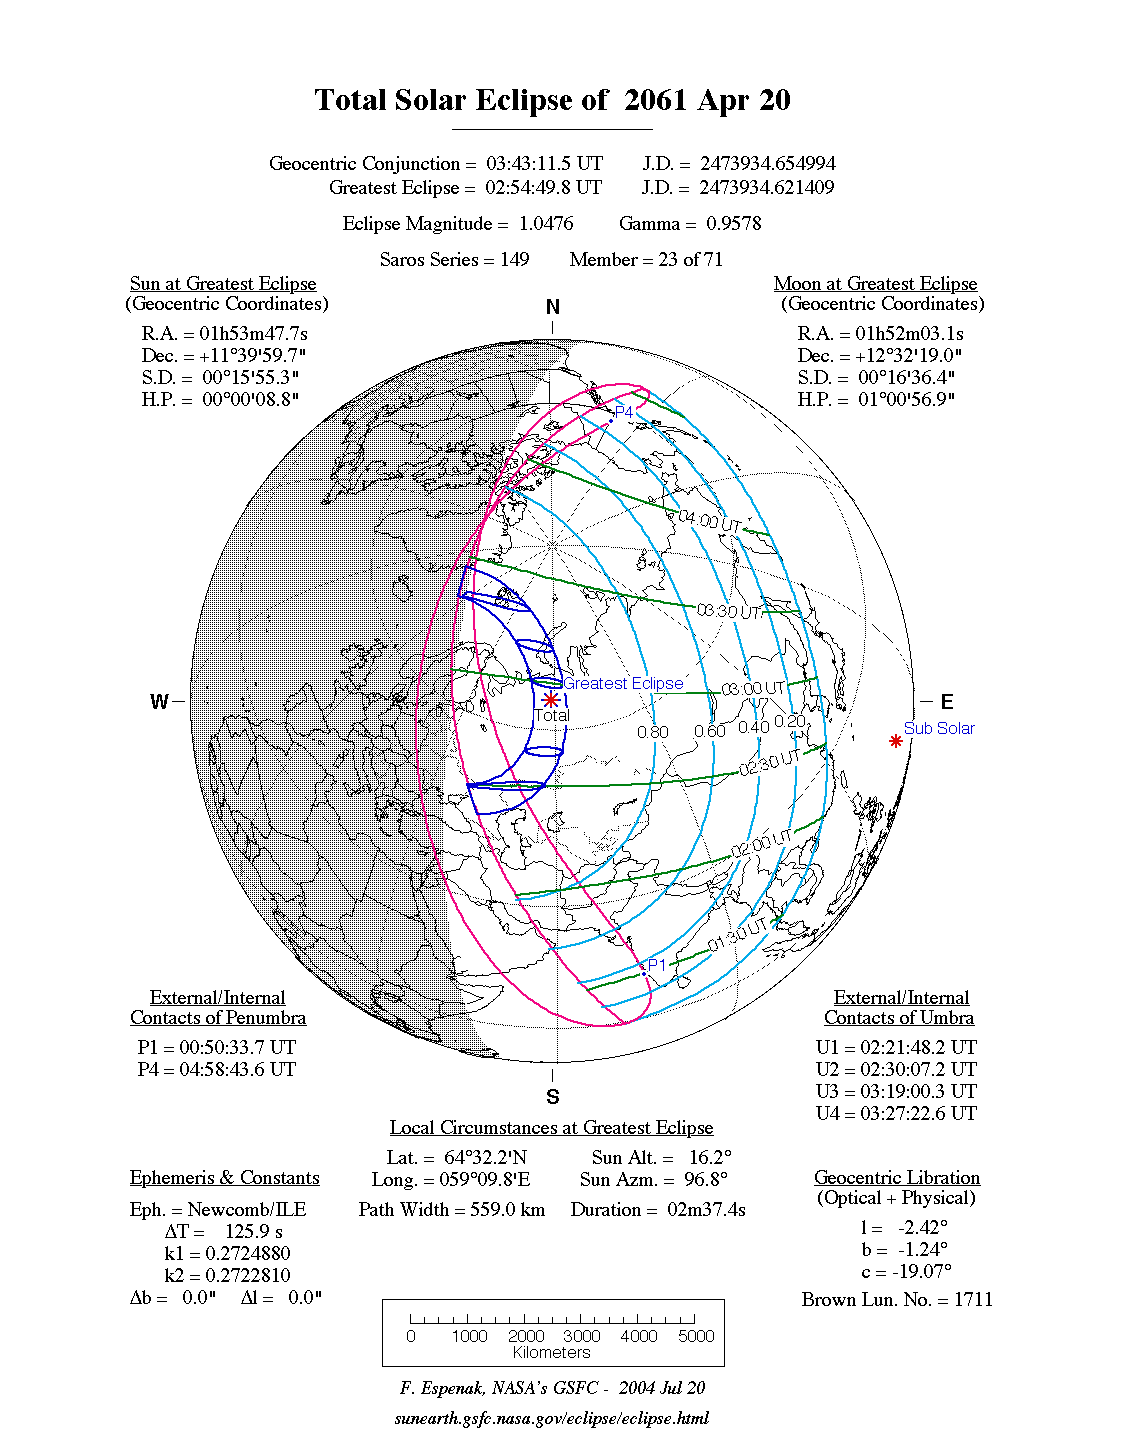
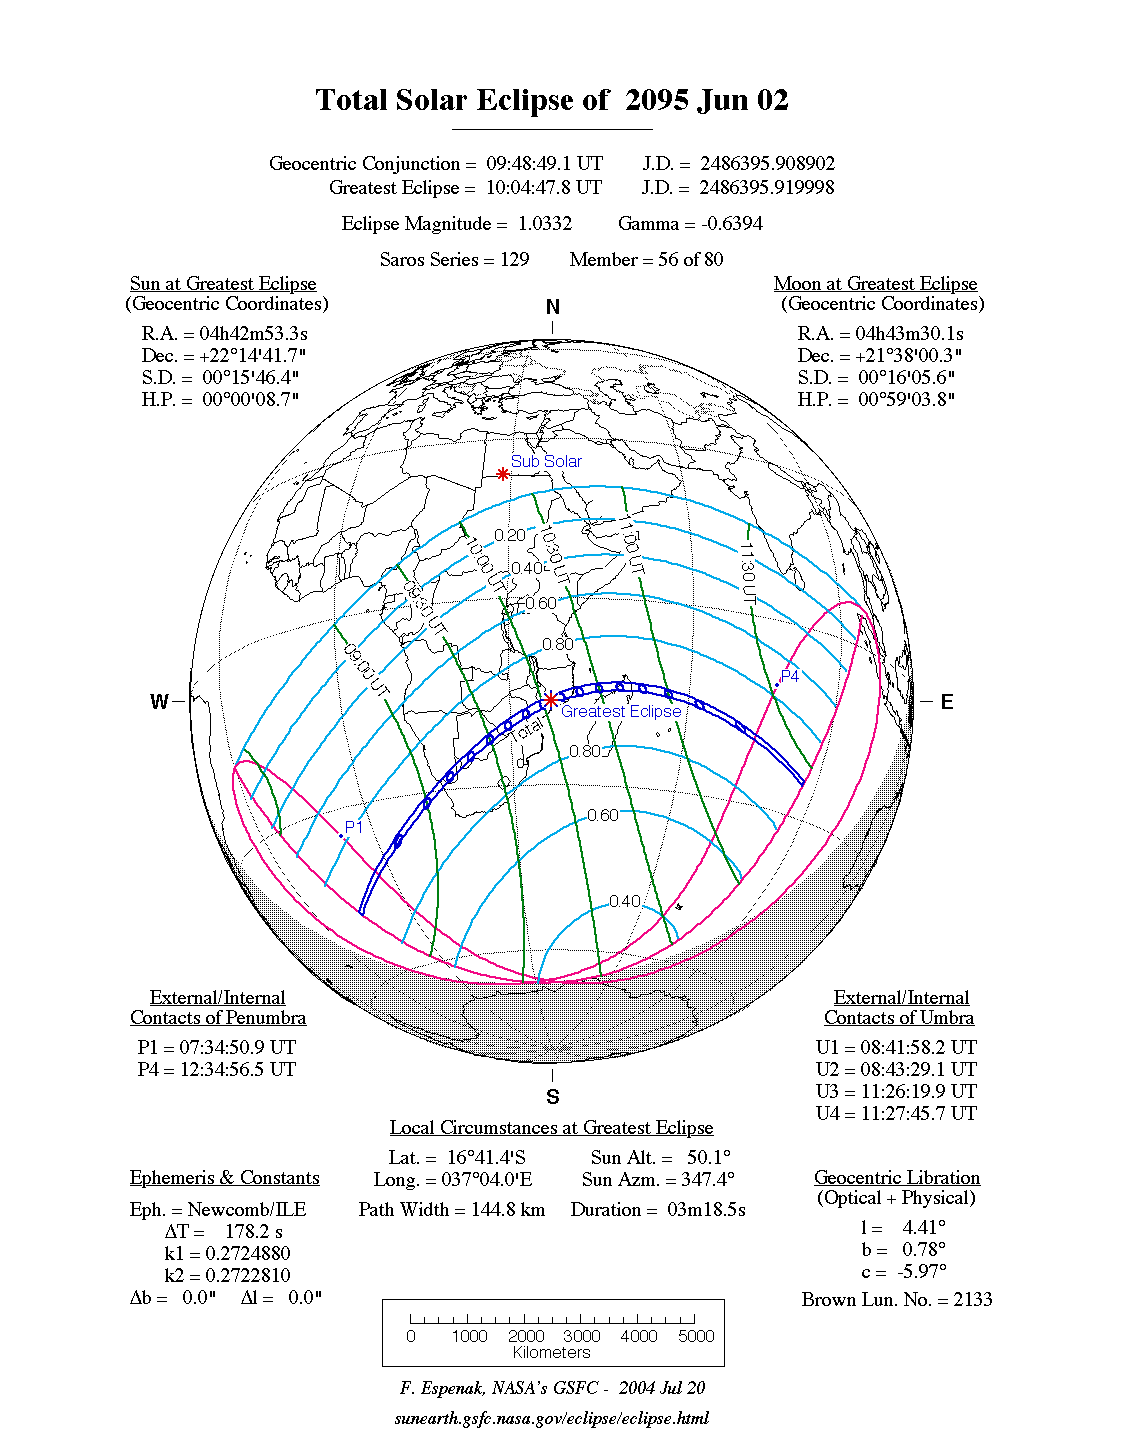
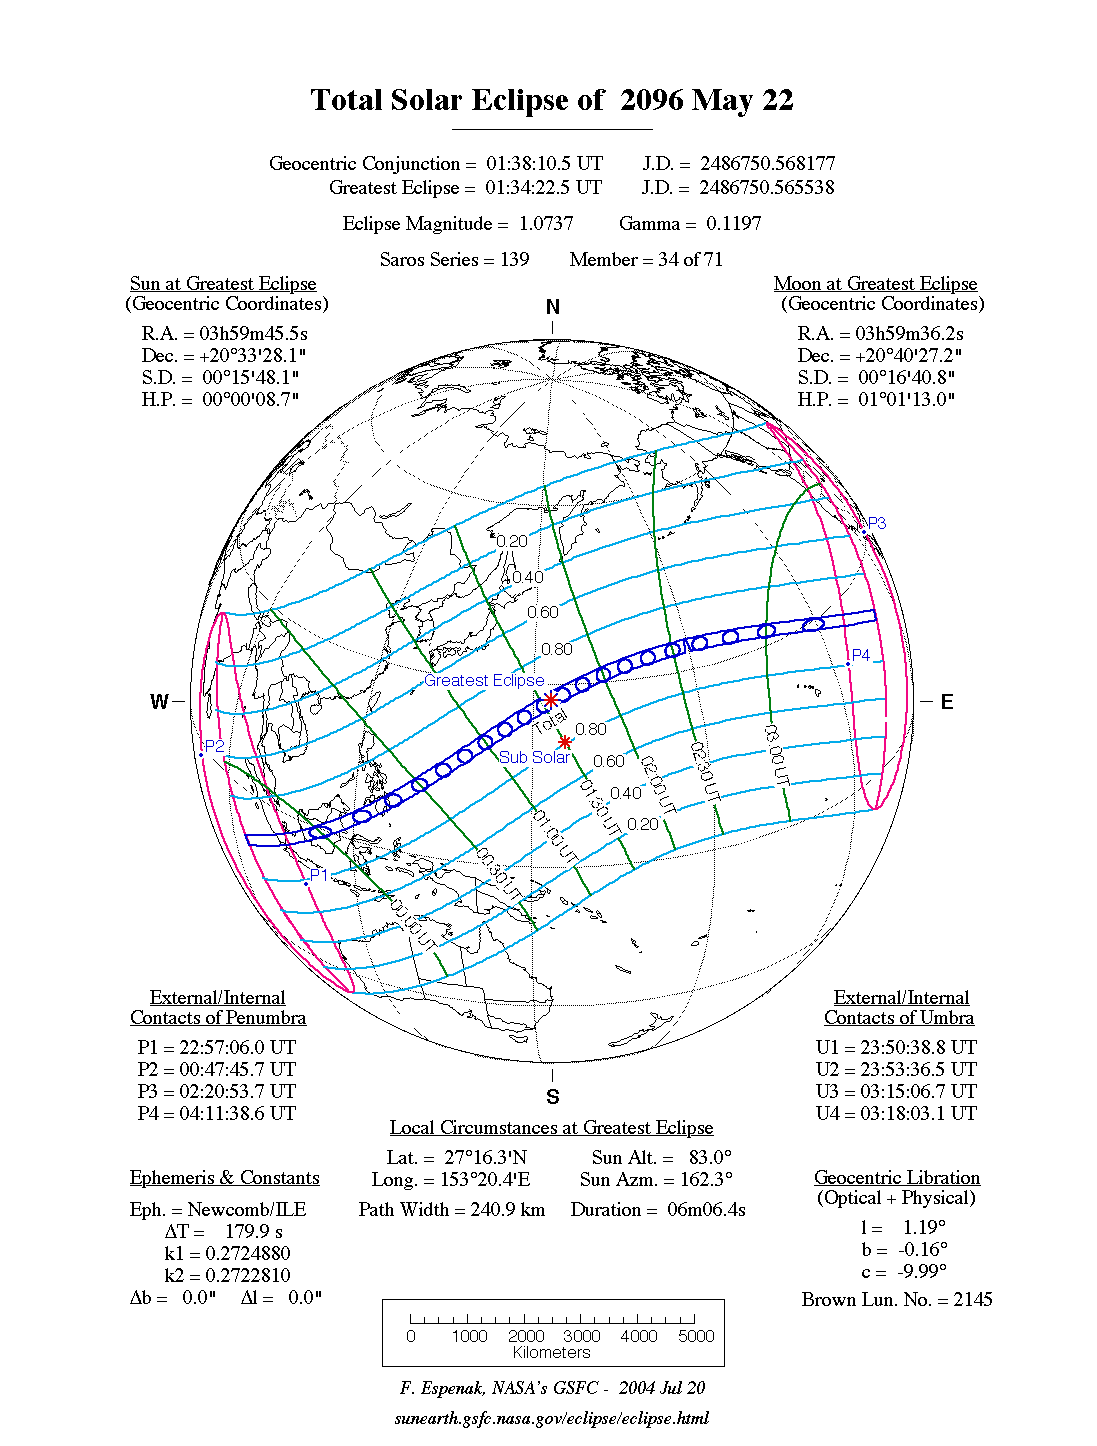
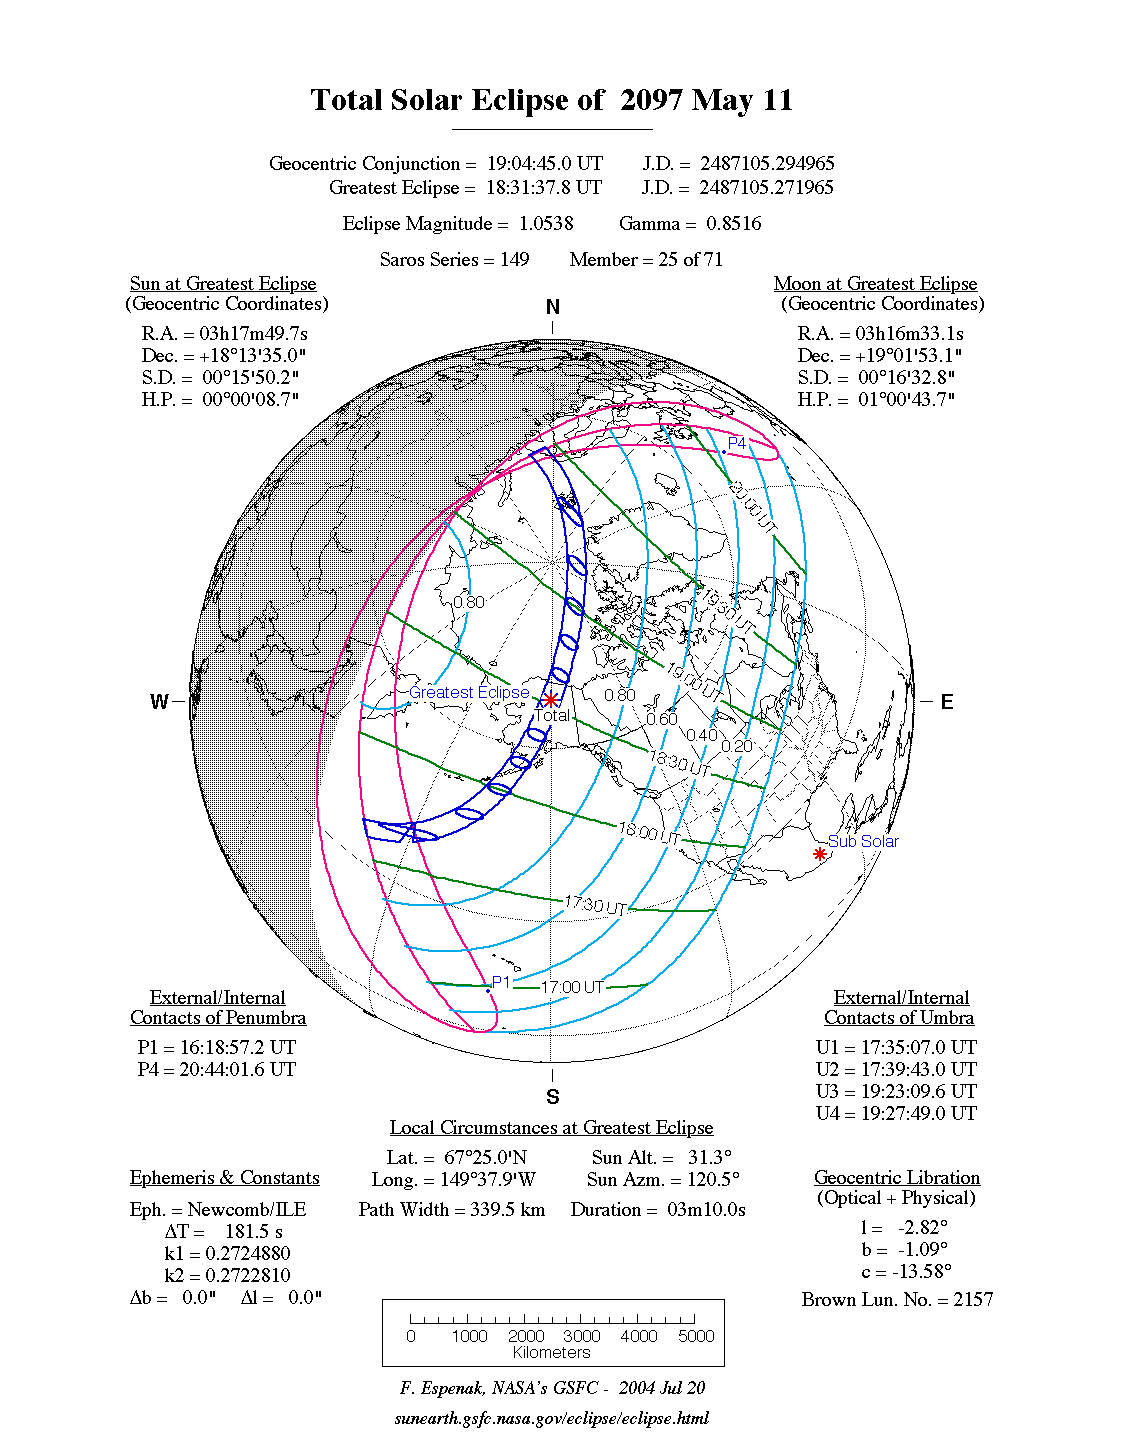
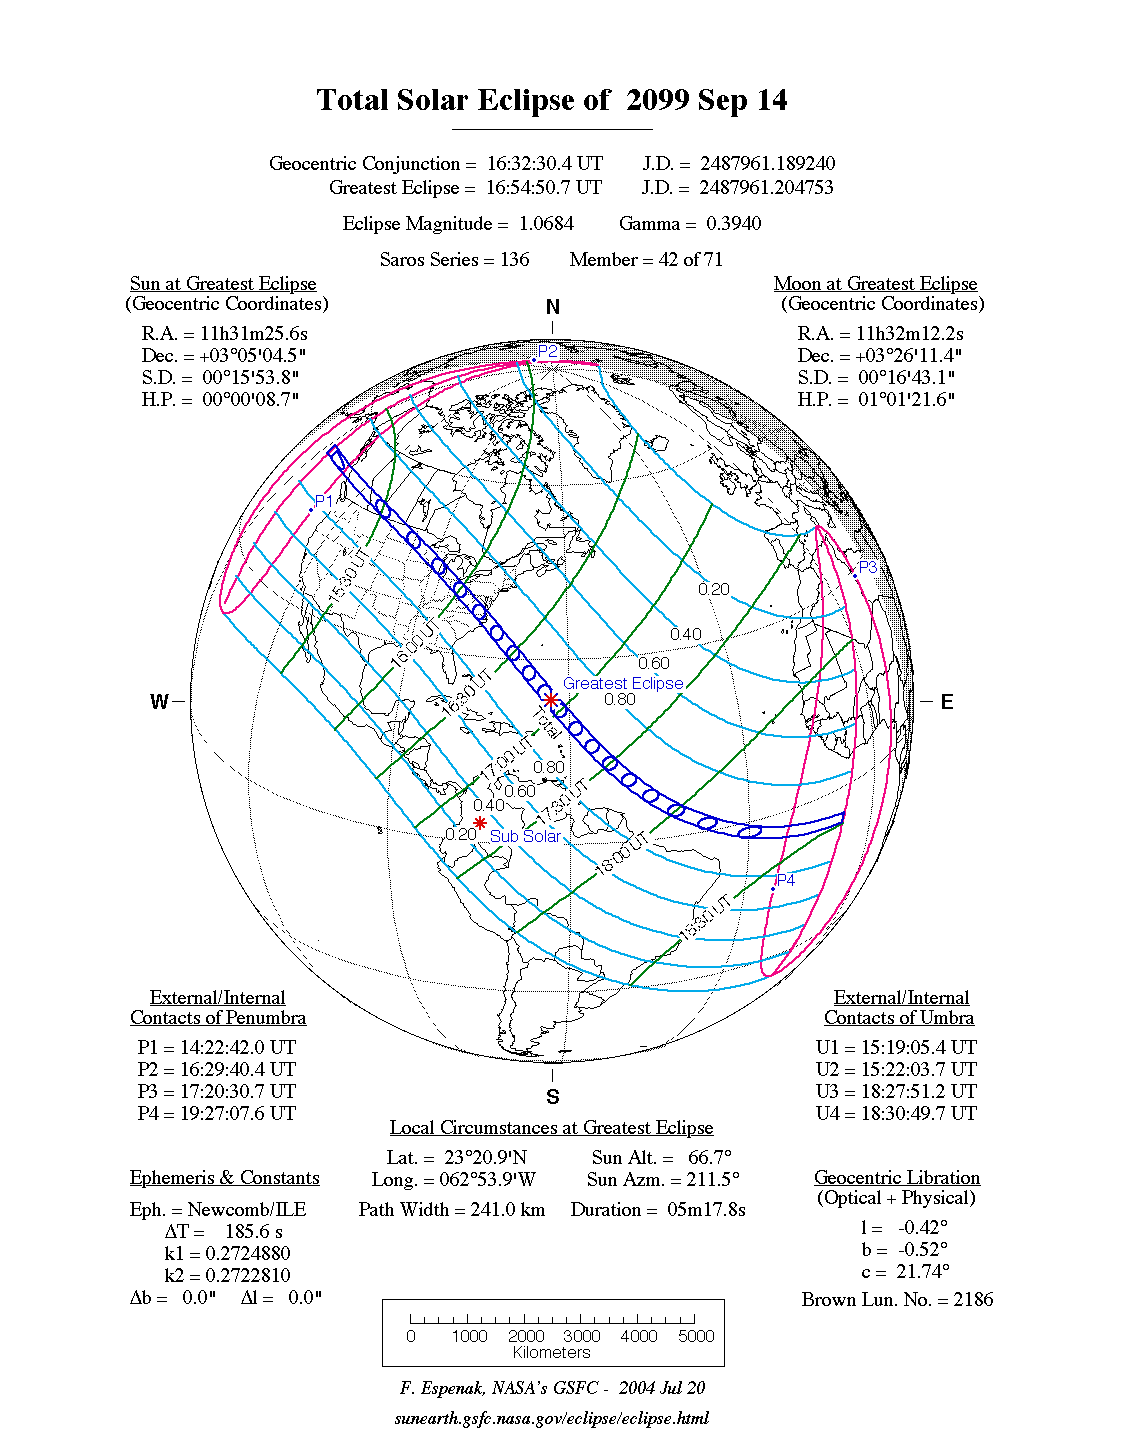
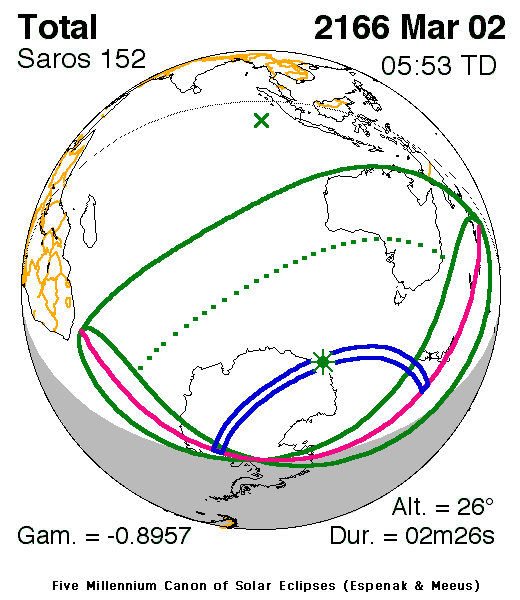
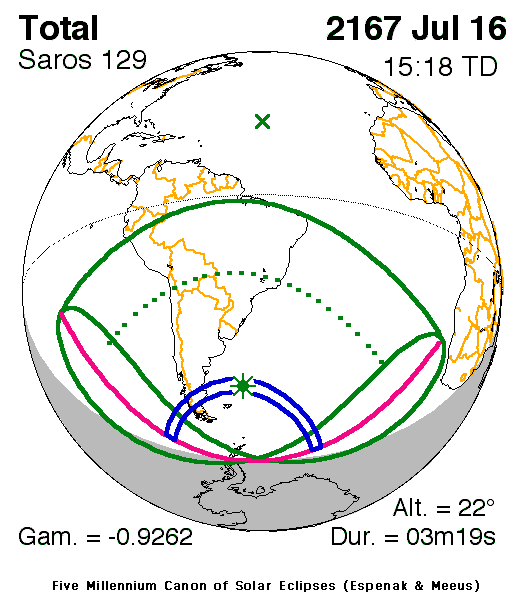
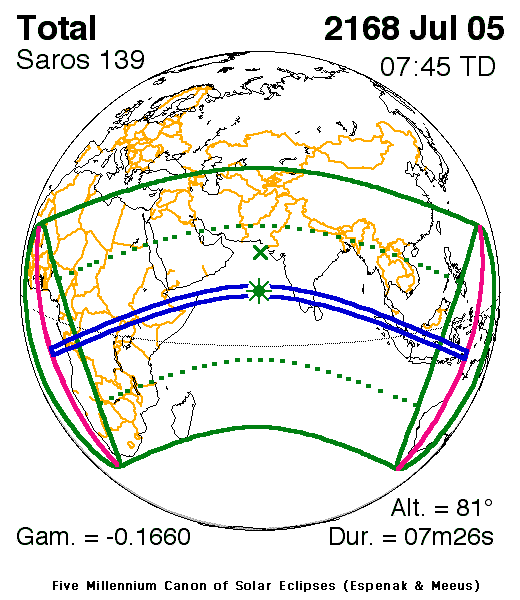
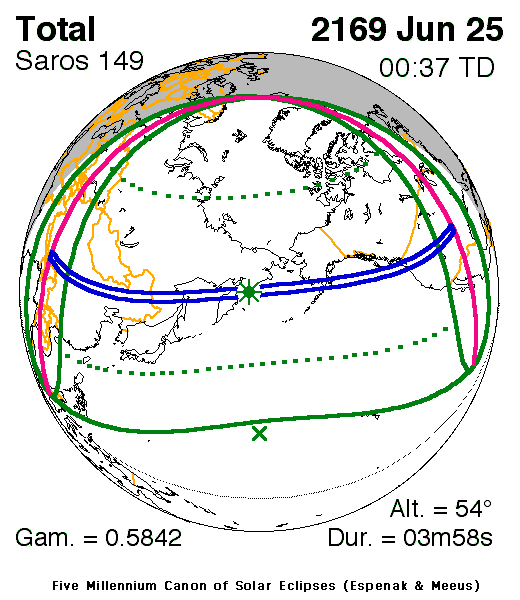
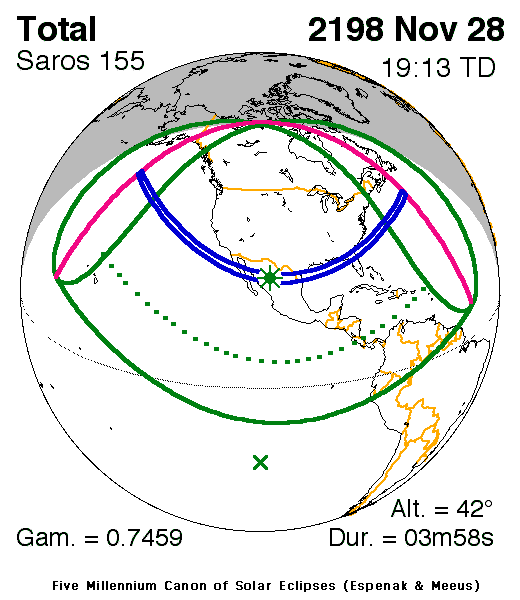
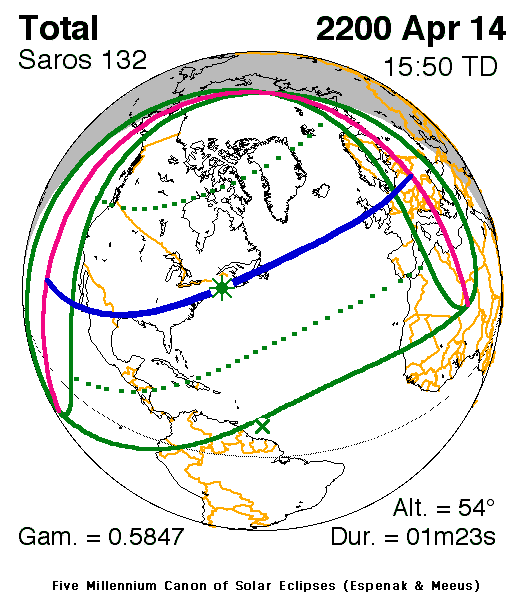
Fred Espenak, Five Millennium Catalog of Solar Eclipses: 2001 to 2100, NASA Goddard Space Flight Center. Source of every eclipse's date, type, and duration at greatest eclipse; the 2101–2200 page covers the 22nd century. Eclipse Predictions by Fred Espenak (NASA's GSFC).↩
Fred Espenak, NASA eclipse path tables and orthographic maps, one per eclipse (e.g. the path of the total solar eclipse of 2 August 2027 and its map). The path tables give the northern and southern limits, central line, and central-line duration at two-minute intervals; they are the basis for every land duration in the calculator. The maps in the appendix are reproduced from the same pages. Eclipse Predictions by Fred Espenak (NASA's GSFC).↩
Natural Earth 1:50m Admin 0 – Countries, via the natural-earth-vector repository. Public domain.↩
Arias E, Xu J, Tejada-Vera B. United States Life Tables, 2024. National Vital Statistics Reports 75(5). Hyattsville, MD: National Center for Health Statistics, 2026. The calculator uses the lx (survivors) column of Tables 1–3 (total population, males, females), downloaded from the NCHS FTP site.↩
Fred Espenak and Jean Meeus, Five Millennium Canon of Solar Eclipses: −1999 to +3000, NASA Technical Publication TP-2006-214141 (2006). The 2101–2200 maps in the appendix are its global maps, from the catalog's 2101–2200 page. Eclipse Predictions by Fred Espenak (NASA's GSFC).↩